|
|
| View previous topic :: View next topic |
| Author |
NIFTY FUTURE LEVELS |
mahson
White Belt

Joined: 08 Aug 2009
Posts: 80
|
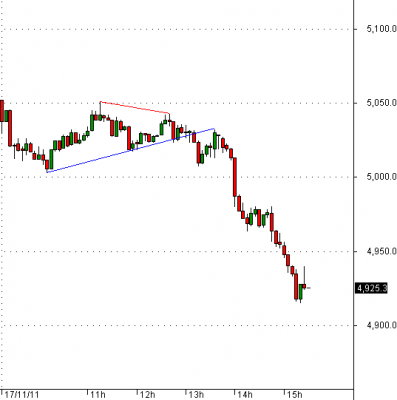
Post: #16  Posted: Thu Nov 17, 2011 3:58 pm Post subject: The Formation of Bearish Pennant Pattern Posted: Thu Nov 17, 2011 3:58 pm Post subject: The Formation of Bearish Pennant Pattern |
 |
|
The Formation of Bearish Pennant Pattern
| Description: |
| The Formation of Bearish Pennant Pattern |
|
| Filesize: |
12.89 KB |
| Viewed: |
395 Time(s) |
|
|
|
| Back to top |
|
 |
|
|  |
vinay28
Black Belt

Joined: 24 Dec 2010
Posts: 11748
|
Post: #17  Posted: Thu Nov 17, 2011 7:34 pm Post subject: Posted: Thu Nov 17, 2011 7:34 pm Post subject: |
 |
|
| Satish, I have taken a chance by buying a bit.
|
|
| Back to top |
|
 |
mahson
White Belt

Joined: 08 Aug 2009
Posts: 80
|
Post: #18  Posted: Fri Nov 18, 2011 8:35 am Post subject: NIFTY FUTURE IMPORTANT LEVELS 18 NOV 2011 Posted: Fri Nov 18, 2011 8:35 am Post subject: NIFTY FUTURE IMPORTANT LEVELS 18 NOV 2011 |
 |
|
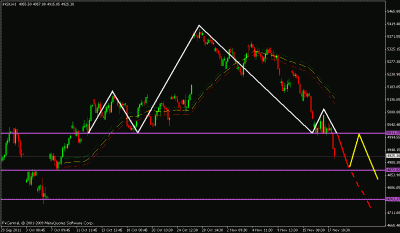
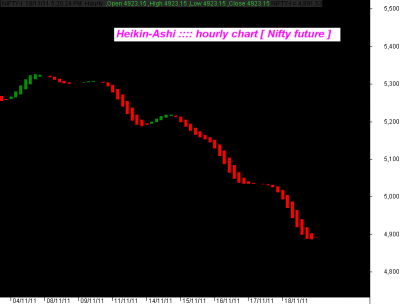
NIFTY FUTURE IMPORTANT LEVELS 18 NOV 2011
HOURLY CHART MA BAND
TREND RESISTANCE : 5121 - 5135
HEAD AND SHOULDERS PATTERN NECKLINE
TRADING RESISTANCE : 4998 -5013.
HORIZONTAL LINE SUPPORT AND RESISTANCE BASE
TRADING SUPPORT : 4882 -4872
HORIZONTAL LINE SUPPORT AND RESISTANCE BASE
TREND SUPPORT : 4761-4749
-----------------------
NIFTY FUTURE INTRADAY TRADING LEVELS
NIFTY FUTURE BUY ABOVE : 5000
TARGETS : 5083 - 5135 - 5219.STOP LOSS 4966
NIFTY FUTURE SELL BELOW 4966
TARGETS : 4882 -4831 -4746.STOP LOSS : 5000
------------------
NIFTY FUTURE POSITIONAL VIEW
NIFTY FUTURE IF TRADE AND HOLD ABOVE OUR BUY TRIGGER POINT THEN CLOSE YOUR ALL SHORT POSITIONS .
HEAD AND SHOULDERS PATTERN FRESH BREAK DOWN TARGET 4602.
-----------------
HEAD AND SHOULDERS TOP PATTERN
FormationHead and Shoulders Top is a bearish reversal pattern that normally forms after an extended uptrend, which marks a shift in trend from bullish to bearish. This pattern is very popular because it is regarded as one of the most reliable of all patterns.
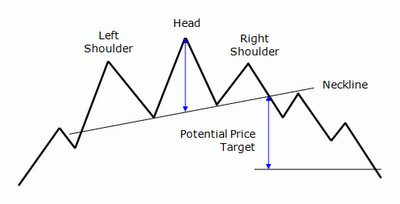
The Formation of Head & Shoulders Top Pattern
Head and Shoulders Top Pattern contains three consecutive, sharp peaks / tops, whereby the middle peak is the highest (Head) and the other two peaks (left & right peaks) are lower & roughly equal in size (Left & Right Shoulders).
This pattern forms when the price is in an existing uptrend. The price increases and hits a high then declines (forming the Left Shoulder). Afterwards, the price increases to an even higher high and then declines again (forming the Head). The Right Shoulder is formed when the price rises again but it does not hit the high of the Head. Instead, the price falls back after it has reached about the same price level as the Left Shoulder.Although the Left & Right Shoulders do not necessarily need to be exactly the same, but it should appear roughly equal to one another.
The important part of this pattern is the Neckline. The Neckline is formed by drawing a line that connects two low points: (1) the low point in between the Left Shoulder & Head, and (2) the low point in between the Head & Right Shoulder.This Neckline can be horizontal, sloping upwards or downwards.
The pattern is only completed and confirmed when the price decreases and closes below the Neckline, which serves as the key support level in this pattern.
Although Head & Shoulders Top is viewed as a common pattern and quite easy to identify, it’s actually not the case. Therefore, one should pay close attention & take proper steps to analyze the characteristics of Head & Shoulders Top in order to minimize / avoid making mistakes in spotting the pattern.
Important Characteristics of Head & Shoulders Top Pattern:
Existing Trend:There should be an established existing UPWARD trend prior to the pattern.
Shape of Head & Shoulders Top Pattern:
1) Head & Shoulders:Ideally, the shape Head & Shoulders should be symmetry. The Left & Right Shoulders should peak at about the same price level. The Left & Right Shoulders should also about the same distance from the Head, which means the time duration to develop the formation between the top of Left Shoulder & the Head should be about the same as that between the Head & the top of Right Shoulder.However, in the real world, the Shoulders are rarely perfectly symmetrical. Sometimes, one shoulder is higher than the other, or takes longer time to develop.In any case, the Left or Right Shoulder should not reach the level of the Head. If it does, the formation is actually not Head & Shoulders Top pattern.
When the peak of the Right Shoulder is lower than the peak of the Left Shoulder, it may carry a higher chance of larger price decline after the breakout, as it implies more weakness & bearish sentiments.
In addition, ideally, the shape Head & Shoulders should also be made up of three upward sharp peaks. But in real world, the Shoulders can be a bit more rounded / flat.Also, sometimes in a more complex formation, the pattern could have more than one head and/or more than two shoulders (e.g. 2 Left Shoulders with about the same size and 2 Right Shoulders that are more or less equivalent to the Left Shoulders). Nevertheless, a more complex formation is more often seen in the Head & Shoulders Bottom than in the Head & Shoulders Top.
2) Neckline:The Neckline that connects the two low points in between the Left Shoulder-Head and the Head-Right Shoulder can be horizontal, sloping upwards or downwards.The slope of the Neckline could predict degree of bearishness of the pattern and hence affect the chance of severe price decline.
An upwards sloping Neckline has a weaker tendency that the price will decline further, as the higher low of the 2nd low point of the Neckline still indicates the strength of bullishness, and thus it carries lower chance of severe price decline.
A downwards sloping Neckline, which rarely happens, is more reliable as a bearish reversal signal, as it may imply stronger bearish sentiments & more rapidly increasing weakness, and hence have a higher chance of severe price decline.
Duration:The duration of the formation of the pattern from the start of the development of Left Shoulder to the break of the Neckline can take several months, normally range from 3 to 6 months.
Breakout:Even when the price has declined from peak of the Right Shoulder, the pattern is not completed yet. The chances that the existing uptrend will continue are still higher than the chances of reversal to take place, as it is normal during an uptrend for the price to test a resistance level a few times, then retreat, and then resume the uptrend again.
Head & Shoulders Top pattern is only completed and confirmed when the price declines and closes below the Neckline, which serves as the key support level in this pattern.
Remember that we should always assume the existing trend (i.e. in this case is uptrend) is in force unless proven otherwise.
Therefore, it is important to wait for the price to make a decisive breakout by breaking through and closing below the Neckline support, preferably accompanied with an increase in volume, in order to avoid jumping the gun and/or prevent deceptive Head & Shoulders Top pattern.
Nevertheless, since this pattern is considered as one of the most reliable pattern and has a relatively high success rate, some aggressive & experienced traders like to enter the market when the price is declining from the peak of the Right Shoulder, provided they are sure that a valid Head & Shoulders Top is forming. But of course, this trade is much riskier and not recommended for novice traders.
Breakout Confirmation:
Sometimes, the price may also make a deceptive/invalid breakout whereby it touches below the Neckline, but then it moves back up again & resumes uptrend.
One possible way to prevent this is by having certain criteria to confirm if the breakout is a valid one.
A minimum penetration criteria for a breakout should be the price closes BELOW the Neckline support, not just an intraday penetration.
Some traders may apply certain price criteria (e.g. 3% - 5% break from the Neckline depending on the stock’s volatility) or time criteria (e.g. the breakout is sustained for 3 days) to confirm the validity of the breakout.
Traders / investors should be more cautious if the price keeps hovering around the Neckline without making a decisive break. When this happens, the reversal might never happen and the uptrend is likely to resume.
Volume:
Volume should be diminishing as the pattern is forming.
Volume is the highest during the formation of the Left Shoulder, and then gets lighter as the pattern develops the Head, and should be the lightest during the formation of Right Shoulder, showing an indication that the buying pressures are getting weaker.
Ideally, during & after the breakout of the Neckline support, the volume should significantly increase again.
When during the decline from peak of the Right Shoulder, the price experiences an accelerated drop, perhaps with a gap down or two, accompanied by an expansion in volume, this might give a good sign, as the price decline tends to drop further, and hence it may provide higher chances that the pattern is a bearish reversal pattern.
Potential Price Target:
1) Compute the height of the pattern: The vertical distance between the top / peak of the Head (which serves as the resistance) and the Neckline (which serves as the key support).
2) To compute the potential price target: Subtract the result from the point where the price finally breaks Neckline.
In general, any price target should only be used as a rough guide. To determine the price target, other factors, such as previous support / resistance levels, Fibonacci retracements, or long-term moving averages, should be considered as well.
Example:
Suppose a Head & Shoulders Top pattern is forming with the Neckline is sloping downward.
The peak of the Head is at 5402 and the Neckline vertically under it is at 5010.
The height of the pattern is therefore 392 ( 5402 - 5010 = 392 ).
Suppose the Neckline was finally broken at 5010.
Hence, the price target would be 4618 (5010 - 392 = 4618).
Return to Breakout Level:
After the breakout occurs, the price may sometimes return to the Neckline for an immediate test of this new resistance level before continuing their moves in the direction of the breakout. (Remember that the support now has turned into new resistance level). It is also normally only a minor & short-lived bounce.
If this price return move happens, it could actually offer an opportunity to participate in the breakout with a better reward to risk ratio.
However, when the breakout occurs with a heavy volume, the chance of the price to return to the breakout level before continuing its downward movement will be smaller.
| Description: |
|
| Filesize: |
16.93 KB |
| Viewed: |
403 Time(s) |
|
| Description: |
|
| Filesize: |
36.86 KB |
| Viewed: |
384 Time(s) |
|
|
|
| Back to top |
|
 |
WhiteSwan
White Belt

Joined: 31 Aug 2011
Posts: 13
|
Post: #19  Posted: Fri Nov 18, 2011 9:15 am Post subject: Amazing Information Posted: Fri Nov 18, 2011 9:15 am Post subject: Amazing Information |
 |
|
Mahson,
I am baffled by the depth of your Analysis charts and write-up. Are you by any chance residing in Bangalore? If so, I would like to get trained by you on Intra-day and Positional strategies. Or is there someone based in Bangalore from whom I can learn?
Cheers.
WhiteSwan-Bangalore.
|
|
| Back to top |
|
 |
mahson
White Belt

Joined: 08 Aug 2009
Posts: 80
|
Post: #20  Posted: Fri Nov 18, 2011 2:00 pm Post subject: Regular Positive Divergence Posted: Fri Nov 18, 2011 2:00 pm Post subject: Regular Positive Divergence |
 |
|
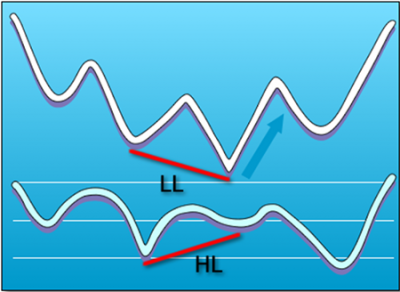
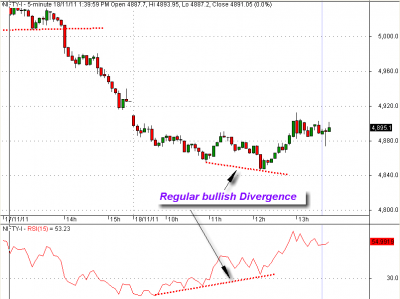
Regular positive Divergence
A regular divergence is used as a possible sign for a trend reversal.
If price is making lower lows (LL), but the oscillator is making higher lows (HL), this is considered to be regular bullish divergence.
This normally occurs at the end of a down trend. After establishing a second bottom, if the oscillator fails to make a new low, it is likely that the price will rise, as price and momentum are normally expected to move in line with each other.
Below is an image that portrays regular bullish divergence.
| Description: |
|
| Filesize: |
223.35 KB |
| Viewed: |
385 Time(s) |
|
| Description: |
|
| Filesize: |
32.58 KB |
| Viewed: |
404 Time(s) |
|
|
|
| Back to top |
|
 |
mahson
White Belt

Joined: 08 Aug 2009
Posts: 80
|
Post: #21  Posted: Sat Nov 19, 2011 8:36 am Post subject: Nifty weekly chart analysis Posted: Sat Nov 19, 2011 8:36 am Post subject: Nifty weekly chart analysis |
 |
|
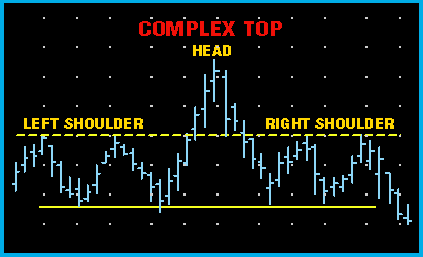
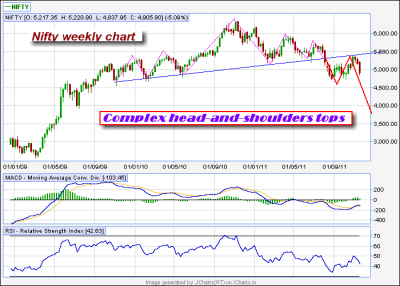
complex head and shoulder top
Nifty future weekly chart,i found Complex head-and-shoulders tops in that chart, as per this pattern break-out target 3935
--------------------------
The Complex Top
The complex top is a broad classification of somewhat irregular patterns that do not fit into any one of the other pattern definitions. One complex top pattern, the complex head-and-shoulders top, is one of the more symmetrical formations that fall into this group. The complex variety of head-and-shoulders tops consists of different numbers and combinations of shoulders and heads, rather than just one head and one each of left and right shoulders, as in the standard variety. The complex head-and-shoulders top occurs less frequently than the standard variety but has the same, if not better, reliability in warning of an impending downturn.
COMPLEX TOP. Here, we see one of the more symmetrical complex top patterns: the complex head-and-shoulders top. These patterns exist with multiple heads and shoulders, but the multiple shoulder with a single-head variety are a little more prevalent. In this formation, the number of shoulders on the left tends to be the same as the number on the right, and they usually form at a relatively equal price level.
Figure 1 shows a complex head-and-shoulders top with one head but two each of the left and right shoulders. Patterns also form with multiple heads, usually two, but such patterns are less common than the multiple-shoulder variation. Complex head-and-shoulders tops tend to be symmetrical; that is, these patterns have the same number of shoulders on both sides, but patterns with different numbers of shoulders on each side do occur. Like the standard head-and-shoulders pattern, the multiple shoulders in the complex pattern, as shown in Figure 1, form at roughly the same price levels. The neckline is drawn connecting the valleys between the shoulders and head, and it is the price level, when broken to the downside, that indicates the completion of the formation.
Volume patterns in the complex head-and-shoulders top have not been consistently repeated, so volume is not definitive in confirming or contradicting the formation of this pattern.
| Description: |
| complex head and shoulder |
|
| Filesize: |
4.18 KB |
| Viewed: |
3294 Time(s) |
|
| Description: |
|
| Filesize: |
22.93 KB |
| Viewed: |
432 Time(s) |
|
| Description: |
|
| Filesize: |
34.13 KB |
| Viewed: |
485 Time(s) |
|
|
|
| Back to top |
|
 |
vinay28
Black Belt

Joined: 24 Dec 2010
Posts: 11748
|
Post: #22  Posted: Sat Nov 19, 2011 8:26 pm Post subject: Posted: Sat Nov 19, 2011 8:26 pm Post subject: |
 |
|
| Mahson, isn't it true that H/S are also most susceptible to false break-outs (downs)?
|
|
| Back to top |
|
 |
mahson
White Belt

Joined: 08 Aug 2009
Posts: 80
|
Post: #23  Posted: Mon Nov 21, 2011 8:50 am Post subject: NIFTY FUTURE IMPORTANT LEVELS 21 NOV 2011 Posted: Mon Nov 21, 2011 8:50 am Post subject: NIFTY FUTURE IMPORTANT LEVELS 21 NOV 2011 |
 |
|
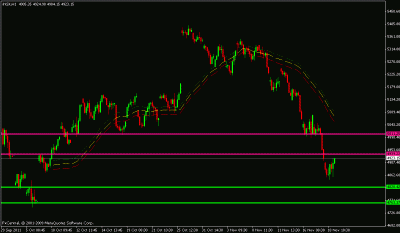
NIFTY FUTURE IMPORTANT LEVELS 21 NOV 2011
HEAD AND SHOULDERS PATTERN NECKLINE
TREND RESISTANCE : 4995 - 5011
HORIZONTAL LINE SUPPORT AND RESISTANCE BASE
TRADING RESISTANCE : 4928 -4938.
HORIZONTAL LINE SUPPORT AND RESISTANCE BASE
TRADING SUPPORT : 4823 -4813
HORIZONTAL LINE SUPPORT AND RESISTANCE BASE
TREND SUPPORT : 4768-4761
-----------------------
NIFTY FUTURE INTRADAY TRADING LEVELS
NIFTY FUTURE BUY ABOVE : 4928
TARGETS : 5011 - 5063 - 5147.STOP LOSS 4896
NIFTY FUTURE SELL BELOW 4896
TARGETS : 4813 -4761 -4678.STOP LOSS : 4928
------------------
NIFTY FUTURE POSITIONAL VIEW
NIFTY FUTURE IF TRADE AND HOLD ABOVE OUR TRADING RESISTANCE THEN CLOSE YOUR ALL SHORT POSITIONS .
HEAD AND SHOULDERS PATTERN FRESH BREAK DOWN TARGET 4602.
-----------------
TARGET DONE
AS PER PATTERN BREAK-OUT TARGET IN DOWN SIDE : 4858.
[ UPDATED DATE 15 NOV 2011]
www.icharts.in/forum/nifty-future-levels-t3874,start,20.html
| Description: |
|
| Filesize: |
13.98 KB |
| Viewed: |
438 Time(s) |
|
|
|
| Back to top |
|
 |
SwingTrader
Site Admin
Joined: 11 Aug 2006
Posts: 2903
Location: Hyderabad, India
|
Post: #24  Posted: Mon Nov 21, 2011 11:31 am Post subject: Posted: Mon Nov 21, 2011 11:31 am Post subject: |
 |
|
Mahson,
Please note that one of the excel spreadsheets you had uploaded recently violated our terms & conditions - it contained a website link and email address. We have edited the spreadsheet and re-posted it this time. Please make sure you edit the files that you post here and make sure they do not violate our T&C. If this is repeated, you will lose your forum access AGAIN.
Thanks.
_________________
Srikanth Kurdukar
@SwingTrader |
|
| Back to top |
|
 |
mahson
White Belt

Joined: 08 Aug 2009
Posts: 80
|
Post: #25  Posted: Tue Nov 22, 2011 8:31 am Post subject: NIFTY FUTURE IMPORTANT LEVELS 22 NOV 2011 Posted: Tue Nov 22, 2011 8:31 am Post subject: NIFTY FUTURE IMPORTANT LEVELS 22 NOV 2011 |
 |
|
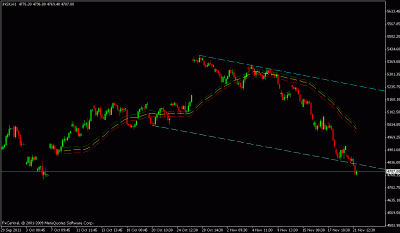
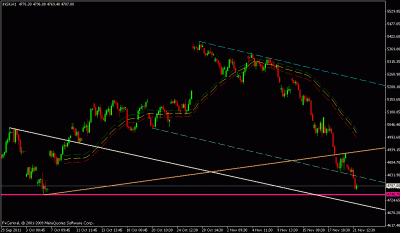
NIFTY FUTURE IMPORTANT LEVELS 22 NOV 2011
TREND WAVE RESISTANCE : 4925 - 4934
DOWN CHANNEL NEGATIVE BREAK-OUT
TRADING RESISTANCE : 4820 -4828.
HORIZONTAL LINE SUPPORT AND RESISTANCE BASE
TRADING SUPPORT : 4752 -4742
TREND WAVE SUPPORT : 4708-4698
-----------------------
NIFTY FUTURE INTRADAY TRADING LEVELS
NIFTY FUTURE BUY ABOVE : 4828
TARGETS : 4888 - 4925 - 4985.STOP LOSS 4805
NIFTY FUTURE SELL BELOW 4805
TARGETS : 4745 -4708 -4648.STOP LOSS : 4828
------------------
NIFTY FUTURE POSITIONAL VIEW
NIFTY FUTURE IF TRADE AND HOLD ABOVE OUR TRADING RESISTANCE THEN CLOSE YOUR ALL SHORT POSITIONS .
TAKE FRESH SHORT POSITION ONLY NIFTY FUTURE IF TRADE BELOW OUR INTRADAY SELL TRIGGER POINT.
DONT FORGET EVERY PULLBACK SHORT OPPERTUNITY.HEAD AND SHOULDERS PATTERN FRESH BREAK DOWN TARGET 4602.
-----------------
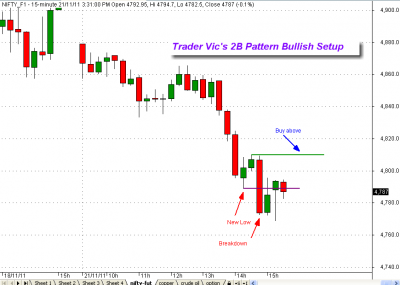
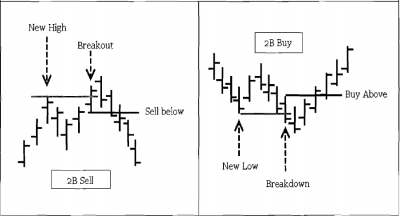
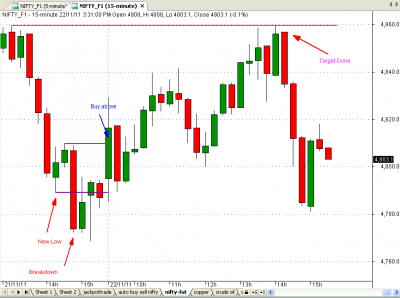
Trader Vics 2B Patterns
"Principles of Professional Speculation" written by Victor Sperandeo (Trader Vic), analyzesone of the powerful top bottom reversal techniques. Trader Vic describes this technique, "In anuptrend, if prices penetrate the previous high, but fail to carry through and immediately dropbelow the previous high, the trend is apt to reverse." The converse is true for a down trend.This pattern is also called "spring." The 2B setup looks like a micro "M" pattern and signalstrend reversal when prices stop making higher-highs in an uptrend.
The 2B pattern rule is when prices make a new high or new low; they pull back for a healthyretracement. After retracement, the price tries to re-test the new high or new low. When thistest of new high or new low fails, and it does not maintain the prices above the new high orlow, it signals a potential trend reversal. This setup is very powerful and signals the beginningof a correction.
Trade : The market attempts to test a recent new high or low, but does not hold the pricesabove this range. Trades are entered to sell the low of the bar trying to breakout or buy thehigh of the bar trying to breakdown.
Target : The target is usually the "swing low" prior to the new high for 2B Buy setup or"swing high" prior to the new low for 2B Sell setup.
Stop: Protect your "long" trade entry by placing a "stop" below the recent low and protect the"short" trade entry by placing a "stop" above the recent high.
| Description: |
|
| Filesize: |
12.19 KB |
| Viewed: |
452 Time(s) |
|
| Description: |
|
| Filesize: |
14.64 KB |
| Viewed: |
427 Time(s) |
|
| Description: |
|
| Filesize: |
29.96 KB |
| Viewed: |
456 Time(s) |
|
| Description: |
|
| Filesize: |
27.45 KB |
| Viewed: |
432 Time(s) |
|
|
|
| Back to top |
|
 |
mahson
White Belt

Joined: 08 Aug 2009
Posts: 80
|
Post: #26  Posted: Tue Nov 22, 2011 3:34 pm Post subject: magazine article Posted: Tue Nov 22, 2011 3:34 pm Post subject: magazine article |
 |
|
ASIA PACIFIC’S PREEMINENT TRADING MAGAZINE
Trader Vics 2B Patterns [ magazine article ] download here
[***** LINK REMOVED BY ADMIN *****]
==========================
dear swingtrader ji
when i upload this pdf in icharts it say " 413 Request Entity Too Large"
what is the solution ?
kindly help me
| Description: |
|
| Filesize: |
35.59 KB |
| Viewed: |
459 Time(s) |
|
|
|
| Back to top |
|
 |
mahson
White Belt

Joined: 08 Aug 2009
Posts: 80
|
Post: #27  Posted: Wed Nov 23, 2011 8:48 am Post subject: NIFTY FUTURE IMPORTANT LEVELS 23 NOV 2011 Posted: Wed Nov 23, 2011 8:48 am Post subject: NIFTY FUTURE IMPORTANT LEVELS 23 NOV 2011 |
 |
|
NIFTY FUTURE IMPORTANT LEVELS 23 NOV 2011
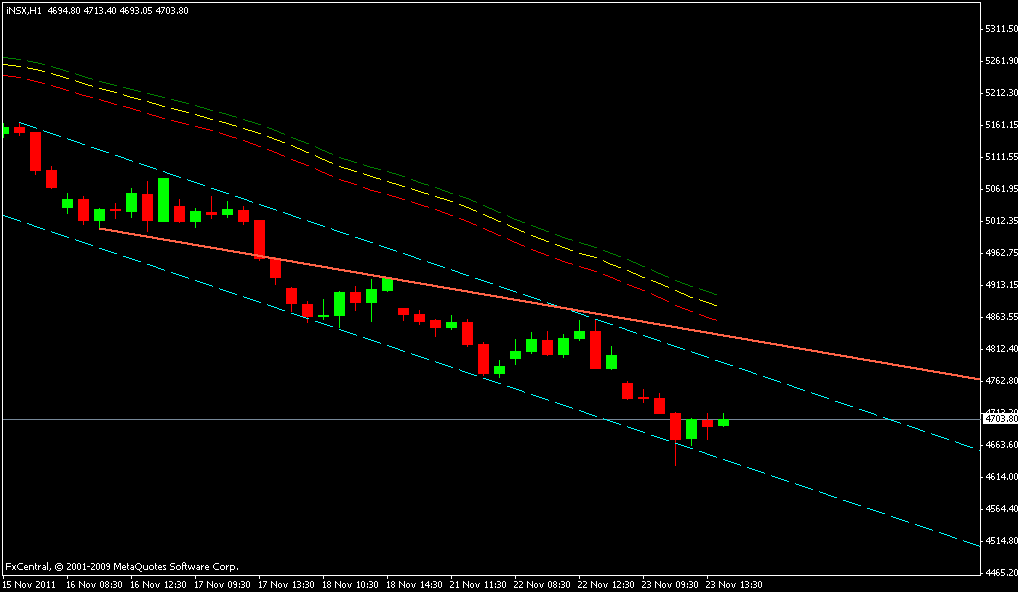
TREND WAVE RESISTANCE : 4910 - 4916
DOWN CHANNEL [ 15 MIN CHART]
TRADING RESISTANCE : 4825 -4840.
HORIZONTAL LINE SUPPORT AND RESISTANCE BASE
TRADING SUPPORT : 4752 -4742
DOWN CHANNEL [ 15 MIN CHART]
TREND WAVE SUPPORT : 4662-4653
-----------------------
NIFTY FUTURE INTRADAY TRADING LEVELS
NIFTY FUTURE BUY ABOVE : 4825
TARGETS : 4881 - 4916 - 4973.STOP LOSS 4803
NIFTY FUTURE SELL BELOW 4803
TARGETS : 4746 -4711 -4654.STOP LOSS : 4825
------------------
NIFTY FUTURE POSITIONAL VIEW
NIFTY FUTURE IF TRADE AND HOLD ABOVE OUR TRADING RESISTANCE THEN CLOSE YOUR ALL SHORT POSITIONS .
TAKE FRESH SHORT POSITION ONLY NIFTY FUTURE IF TRADE BELOW OUR INTRADAY SELL TRIGGER POINT.
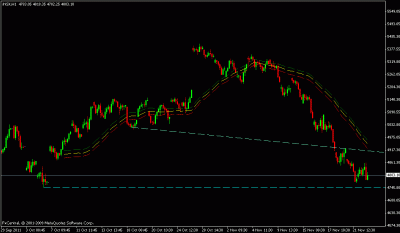
DONT FORGET EVERY PULLBACK SHORT OPPERTUNITY.HEAD AND SHOULDERS PATTERN FRESH BREAK DOWN TARGET 4602.
-----------------
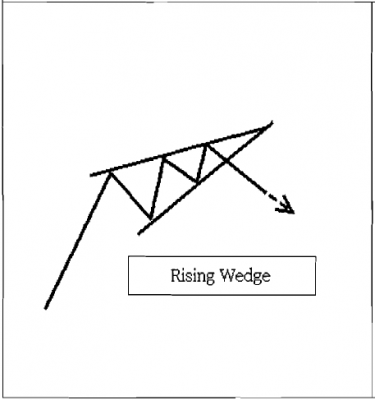
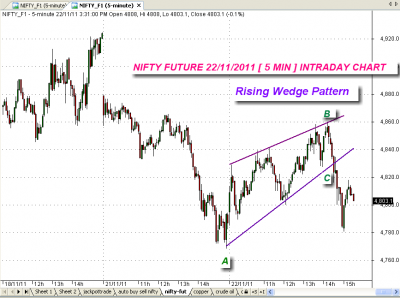
Rising Wedge Pattern
"Rising Wedge" patterns are similar to "Symmetric Triangles" but "Rising Wedge" patterns form in an angle where as "Symmetric Triangles" are mostly horizontally formed. "Rising wedge" patterns have higher highs and higher lows and are connected with two angled (slanted) trend lines. These trend lines converge at the top. The price must intersect each trend line at least twice before the pattern fblly emerges.
"Rising wedges" are usually bearish in both uptrend and downtrend markets. In addition, they
have a high failure rate and are relatively difficult to spot them. They seem to work well in bullish markets.
Trade: "Rising wedges" are defined by the trend lines connecting the highs and lows of the pattern.
The price trading outside the lower trend line signals a potential short trade. A "short" trade isentered when the prices close below the breakdown's bars low (must be below the trendline).
Target: After trade entry, a target is set at the lowest point in the wedge formation. Another targetmeasure would be the length of "wedge" pattern from the breakdown level.
Stop: Place a "stop" order above the last "swing high" of the "wedge" pattern.
Trading Rising Wedge Pattern
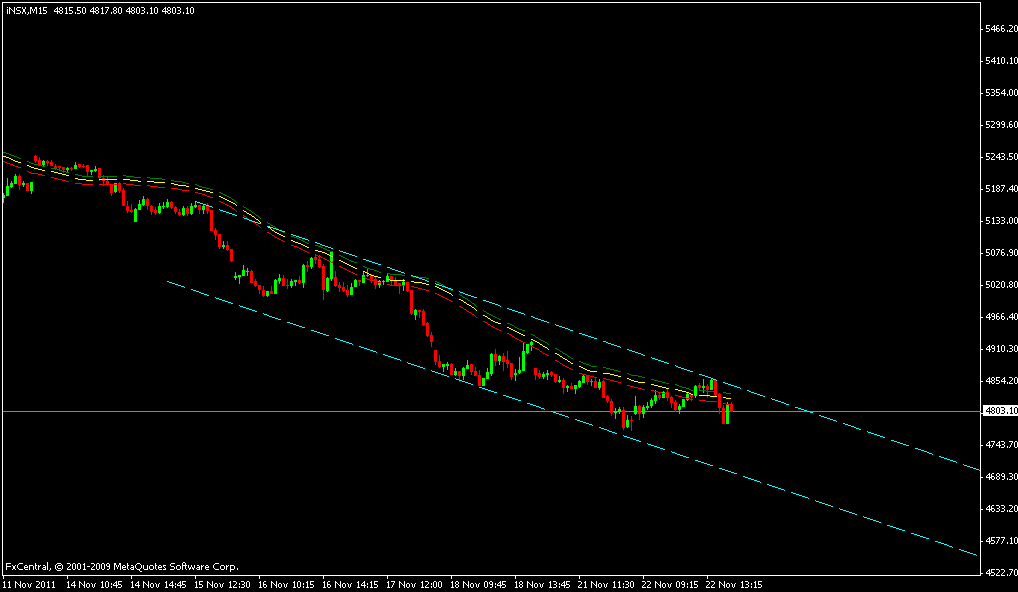
The example above illustrates a "Rising wedge" pattern from the nifty future 22NOV2011 5 min chart. nifty future made a "Rising wedge" pattern in a downtrend. The pattern suggests a pullback rally in downtrend. nifty future made higher highs and higher lows with trend lines connecting in an angle suggesting a potential opportunity for a "short" trade when prices close below the trend line.
1. Enter a "short" trade below the low of the breakdown bar (at C).
2. Place a "stop" order few ticks above previous swing high at B.
3. The first target is placed at 100% of the AB range from C.
| Description: |
|
| Filesize: |
10.29 KB |
| Viewed: |
2822 Time(s) |
|
| Description: |
|
| Filesize: |
12.46 KB |
| Viewed: |
442 Time(s) |
|
| Description: |
|
| Filesize: |
45.8 KB |
| Viewed: |
429 Time(s) |
|
| Description: |
|
| Filesize: |
13.2 KB |
| Viewed: |
435 Time(s) |
|
|
|
| Back to top |
|
 |
mahson
White Belt

Joined: 08 Aug 2009
Posts: 80
|
Post: #28  Posted: Thu Nov 24, 2011 8:18 am Post subject: NIFTY FUTURE IMPORTANT LEVELS 24 NOV 2011 Posted: Thu Nov 24, 2011 8:18 am Post subject: NIFTY FUTURE IMPORTANT LEVELS 24 NOV 2011 |
 |
|
NIFTY FUTURE IMPORTANT LEVELS 24 NOV 2011
TREND WAVE RESISTANCE : 4806 - 4823
DOWN CHANNEL [ HOURLY CHART]
TRADING RESISTANCE : 4825 -4840.
HEAD AND SHOULDER PATTERN BREAK OUT TARGET AND
TRADING SUPPORT : 4621 -4606
FIBO SUPPORT [WEEKLY CHART]
TREND WAVE SUPPORT : 4509-4496
-----------------------
NIFTY FUTURE INTRADAY TRADING LEVELS
NIFTY FUTURE BUY ABOVE : 4698
TARGETS : 4765 - 4806 - 4873.STOP LOSS 4673
NIFTY FUTURE SELL BELOW 4673
TARGETS : 4606 -4565 -4498.STOP LOSS : 4698
------------------
NIFTY FUTURE POSITIONAL VIEW
NIFTY FUTURE IF TRADE AND HOLD ABOVE OUR TRADING RESISTANCE THEN CLOSE YOUR ALL SHORT POSITIONS .
TAKE FRESH SHORT POSITION ONLY NIFTY FUTURE IF TRADE BELOW OUR INTRADAY SELL TRIGGER POINT.
DONT FORGET EVERY PULLBACK SHORT OPPERTUNITY.HEAD AND SHOULDERS PATTERN FRESH BREAK DOWN TARGET 4602.
-----------------
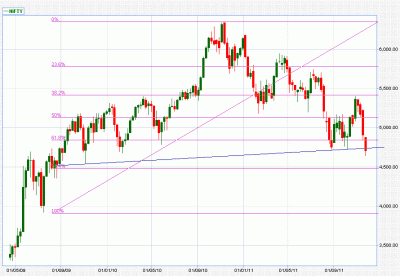
Fibonacci Methods
[***** IMAGE REMOVED BY ADMIN *****]
Fibonacci numbers are pervasive in the universe and were originally derived by LeonardoFibonacci. The basic Fibonacci ratio or "Fib ratio" is the Golden Ratio (1.61  . FibonacciNumbers are a sequence of numbers where each number is the sum of the previous twonumbers. . FibonacciNumbers are a sequence of numbers where each number is the sum of the previous twonumbers.
The series of Fib Numbers begin as follows: 1,1,2,3,5,8,13.............
There are plenty of materials and books about the theory of how these numbers exist in natureand in the financial world. A list of the most important Fib ratios in the financial world whichare derived by squaring, square-roots and reciprocating the actual Fibonacci Numbers aredepicted below:
Key Set of Fibonacci Derived Ratios in Trading are:
0.382, 0.500, -618, 0.786, 1.0, 1.272, 1.618, 2.0,2.62, 3.62,4.62
Secondary Set of Fibonacci Derived Ratios in Trading are:
0.236, 0.486,0.886, 1.13,2.236, 3.14,4.236
Most trading software packages have Fibonacci drawing tools which can show Fibretracements, Fib Extensions and Fib Projections. In addition. Fib Numbers are also applied to"time" and to "price" in trading.
| Description: |
|
| Filesize: |
10.7 KB |
| Viewed: |
2774 Time(s) |
|
| Description: |
|
| Filesize: |
23.1 KB |
| Viewed: |
441 Time(s) |
|
|
|
| Back to top |
|
 |
SwingTrader
Site Admin
Joined: 11 Aug 2006
Posts: 2903
Location: Hyderabad, India
|
Post: #29  Posted: Thu Nov 24, 2011 8:56 am Post subject: Posted: Thu Nov 24, 2011 8:56 am Post subject: |
 |
|
mahson,
I have removed the fib image you had posted. Do not post external website image link, upload image here to attach to the post.
I hope you understand what I am saying. I have warned you just a day ago but you do not seem to understand that you continue to break our T&C rules by posting links to your website. One more violation and you will lose access to the forum permanently.
Kindly follow the forum posting rules.
_________________
Srikanth Kurdukar
@SwingTrader |
|
| Back to top |
|
 |
mahson
White Belt

Joined: 08 Aug 2009
Posts: 80
|
Post: #30  Posted: Thu Nov 24, 2011 11:49 am Post subject: Posted: Thu Nov 24, 2011 11:49 am Post subject: |
 |
|
| SwingTrader wrote: | mahson,
I have removed the fib image you had posted. Do not post external website image link, upload image here to attach to the post.
I hope you understand what I am saying. I have warned you just a day ago but you do not seem to understand that you continue to break our T&C rules by posting links to your website. One more violation and you will lose access to the forum permanently.
Kindly follow the forum posting rules. |
==========================
dear swingtrader ji
when i upload this image in icharts it say " 413 Request Entity Too Large"
what is the solution ?
kindly help me
|
|
| Back to top |
|
 |
|
|
You cannot post new topics in this forum
You cannot reply to topics in this forum
You cannot edit your posts in this forum
You cannot delete your posts in this forum
You cannot vote in polls in this forum
You can attach files in this forum
You can download files in this forum
|
Powered by phpBB © 2001, 2005 phpBB Group
|
|
|

