| View previous topic :: View next topic |
| Author |
NIFTY FUTURE LEVELS |
SwingTrader
Site Admin
Joined: 11 Aug 2006
Posts: 2903
Location: Hyderabad, India
|
Post: #31  Posted: Thu Nov 24, 2011 12:31 pm Post subject: Posted: Thu Nov 24, 2011 12:31 pm Post subject: |
 |
|
Mahson,
The error indicates that you are trying to upload a large file. We restrict the file size to 1 MB only, you cannot upload files larger than that size. You can continue to upload the file to a file sharing website and post the link here but our objection was due to you posting your website link in the file's description/summary on the file sharing website.
_________________
Srikanth Kurdukar
@SwingTrader |
|
| Back to top |
|
 |
|
|
 |
mahson
White Belt

Joined: 08 Aug 2009
Posts: 80
|
Post: #32  Posted: Fri Nov 25, 2011 8:52 am Post subject: NIFTY FUTURE IMPORTANT LEVELS 25 NOV 2011 Posted: Fri Nov 25, 2011 8:52 am Post subject: NIFTY FUTURE IMPORTANT LEVELS 25 NOV 2011 |
 |
|
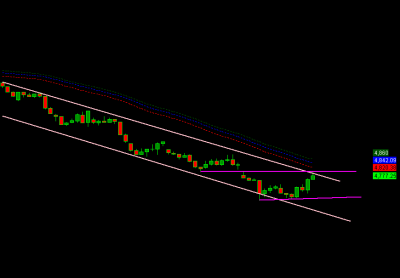
NIFTY FUTURE IMPORTANT LEVELS 25 NOV 2011
MA BAND TREND WAVE RESISTANCE : 4852 - 4866
CHANNEL [ HOURLY CHART]
TRADING RESISTANCE : 4808 -4824.
CHANNEL [ HOURLY CHART ]
TRADING SUPPORT : 4668 -4660
TREND WAVE SUPPORT : 4566-4551
-----------------------
NIFTY FUTURE INTRADAY TRADING LEVELS
NIFTY FUTURE BUY ABOVE : 4698
TARGETS : 4765 - 4806 - 4873.STOP LOSS 4673
NIFTY FUTURE SELL BELOW 4673
TARGETS : 4606 -4565 -4498.STOP LOSS : 4698
------------------
NIFTY FUTURE POSITIONAL VIEW
NIFTY FUTURE IF TRADE AND HOLD ABOVE OUR TRADING RESISTANCE THEN CLOSE YOUR ALL SHORT POSITIONS .
TAKE FRESH SHORT POSITION ONLY NIFTY FUTURE IF TRADE BELOW OUR INTRADAY SELL TRIGGER POINT.
DONT FORGET EVERY PULLBACK SHORT OPPERTUNITY.HEAD AND SHOULDERS PATTERN FRESH BREAK DOWN TARGET 4602.
-----------------
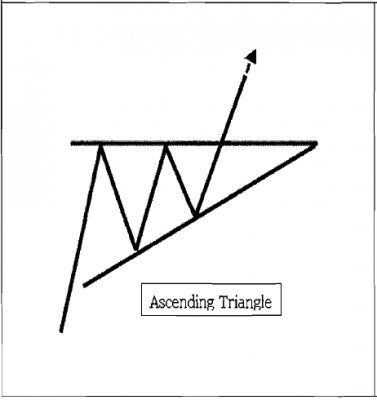
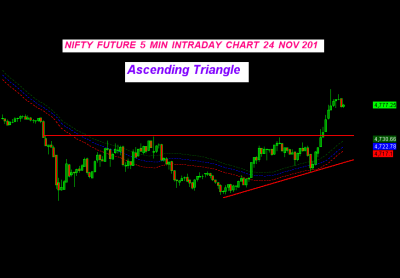
Ascending Triangle
"Ascending Triangles" form when prices attempt to make "higher highs" and "lower lows"suggesting a bullish price trend. The "Ascending triangle" is bound by two trendlines: ahorizontal line at the top and an upward slope trend line connecting the lower lows."Ascending triangles" form in any market and are quite reliable. The "Triangle" prices mustintersect the trend lines at least twice (each) before the pattern is complete. Usually at the thirdor fourth attempt to trade outside the top trend line results in a breakout. Breakouts occur nearthe apex of the triangle. This pattern has a high success rate as it meets its target about 75% ofthe time.
Trade:Trade a clear breakout of the top trend line. Enter a "long" trade one tick above the high of thebreakout bar. Confirm the breakout by volume or other indicators.
Target:"Ascending triangles" have excellent success in reaching target areas. The usual target wouldbe the depth of the "Triangle". Measure the distance (depth) between the top trend line andlowest of the upward slope trend line. Add this depth to the breakout point from the top of thetrend line. Targets are also set at 50% of depth level for partial exits.
Stop: Place a "stop"order when the price closes below the low of the lower trend line or amajor swing low.
| Description: |
|
| Filesize: |
21.41 KB |
| Viewed: |
480 Time(s) |
|
| Description: |
|
| Filesize: |
14.73 KB |
| Viewed: |
475 Time(s) |
|
| Description: |
|
| Filesize: |
28.9 KB |
| Viewed: |
472 Time(s) |
|
|
|
| Back to top |
|
 |
vinay28
Black Belt

Joined: 24 Dec 2010
Posts: 11748
|
Post: #33  Posted: Fri Nov 25, 2011 9:26 am Post subject: Posted: Fri Nov 25, 2011 9:26 am Post subject: |
 |
|
Dear ST
I have requested this before. 1 MB is too small in today's world. 
Thank you in advance for your understanding
Vinay
|
|
| Back to top |
|
 |
mahson
White Belt

Joined: 08 Aug 2009
Posts: 80
|
Post: #34  Posted: Tue Nov 29, 2011 8:08 am Post subject: NIFTY FUTURE IMPORTANT LEVELS 29 NOV 2011 Posted: Tue Nov 29, 2011 8:08 am Post subject: NIFTY FUTURE IMPORTANT LEVELS 29 NOV 2011 |
 |
|
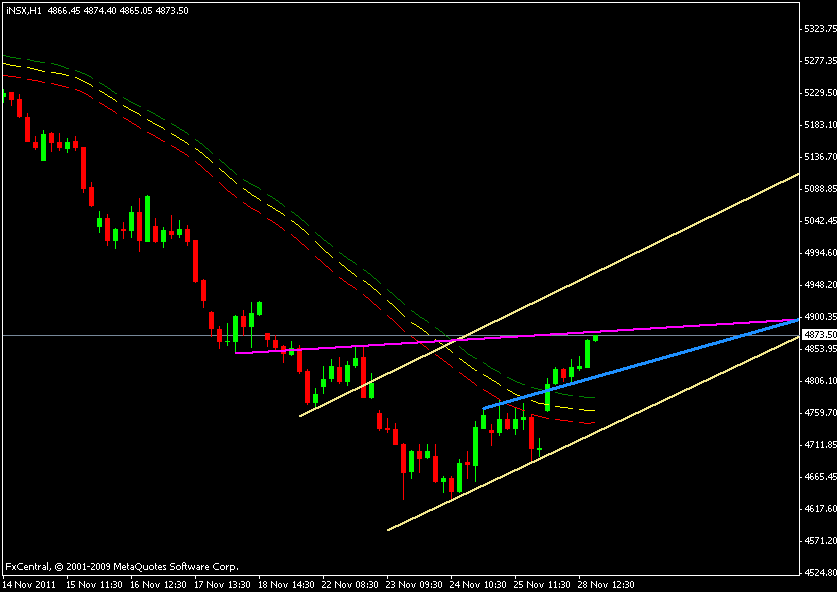
NIFTY FUTURE IMPORTANT LEVELS 29 NOV 2011
CHANNEL [ HOURLY CHART]
TREND WAVE RESISTANCE : 4978 - 4998
NEGATIVE BREAK OUT
TRADING RESISTANCE : 4891 -4904.
POSITIVE BREAK OUT
TRADING SUPPORT : 4831 -4818
UP CHANNEL [ HOURLY CHART]
TREND WAVE SUPPORT : 4760-4742
-----------------------
NIFTY FUTURE INTRADAY TRADING LEVELS
NIFTY FUTURE BUY ABOVE : 4848
TARGETS : 4891 - 4919 - 4962.STOP LOSS 4831
NIFTY FUTURE SELL BELOW 4831
TARGETS : 4787 -4760 - 4716.STOP LOSS : 4848
------------------
NIFTY FUTURE POSITIONAL VIEW
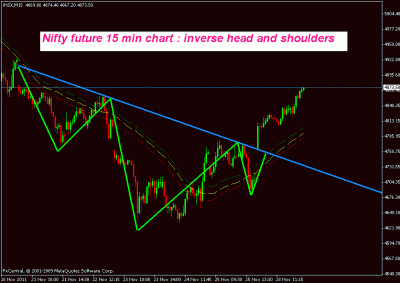
NIFTY FUTURE NOW FORMING INVERSE HEAD AND SHOULDERS PATTERN IN 15 MIN TIME FRAME.
AS THIS PATTERN BREAK OUT TARGET 4954
FRESH LONG POSITIONS KEEP STOP LOSS AS OUR TREND SUPPORT LEVEL.
-----------------
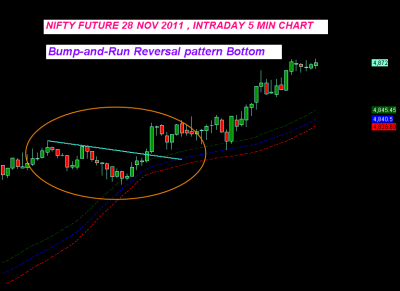
Bump and run reversal pattern
Bump and run reversal or BARR is a chart pattern indicating the reversal of an existing trend. The pattern was first identified by Thomas Bulkowski and was originally named Bump and Run Formation (BARF). Bump and run reversal is usually a long-term chart pattern which forms as a result of excessive speculation that drives the price too fast to the extremes and then shows a reversal.
There are both bullish and bearish versions of bump and run reversal. Bullish BARR pattern forms when excessive speculation drives the price down forming a large downtrend and an over-sold situation. The price rises sharply when more investors start to buy. Similarly bearish BARR pattern forms when excessive speculation drives the price up too fast, forming an over-bought situation. The price starts to fall when investors start to sell.
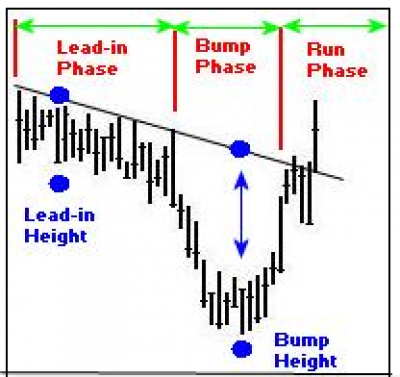
Bump and run reversal pattern comprises 3 different phases:
The lead-in phase is identified by a gradual trend development where the price rises/falls forming a trend. The trendline is moderately steep with average/low trading volume. The lead-in phase takes a month or more to form.
The bump phase is identified by sharp increase or decrease in price in the direction of the trend. The new trendline deviates too much (45 to 65 degrees) from the original trendline; and there is also a great increase in trading volume.
The run phase is identified when the price falls/rises to cross the original trendline. The breakout confirms trend reversal.

| Description: |
|
| Filesize: |
11.27 KB |
| Viewed: |
2688 Time(s) |
|
| Description: |
|
| Filesize: |
18.17 KB |
| Viewed: |
484 Time(s) |
|
| Description: |
|
| Filesize: |
32.39 KB |
| Viewed: |
461 Time(s) |
|
| Description: |
|
| Filesize: |
41.79 KB |
| Viewed: |
460 Time(s) |
|
|
|
| Back to top |
|
 |
jovika
White Belt

Joined: 20 Nov 2011
Posts: 1
|
Post: #35  Posted: Tue Nov 29, 2011 11:53 am Post subject: Posted: Tue Nov 29, 2011 11:53 am Post subject: |
 |
|
nice updates
keep it up bro....
regards,
|
|
| Back to top |
|
 |
mahson
White Belt

Joined: 08 Aug 2009
Posts: 80
|
Post: #36  Posted: Thu Dec 01, 2011 8:00 am Post subject: NIFTY FUTURE IMPORTANT LEVELS 01 DEC 2011 Posted: Thu Dec 01, 2011 8:00 am Post subject: NIFTY FUTURE IMPORTANT LEVELS 01 DEC 2011 |
 |
|
NIFTY FUTURE IMPORTANT LEVELS 01 DEC 2011
NIFTY FUTURE POSITIONAL VIEW
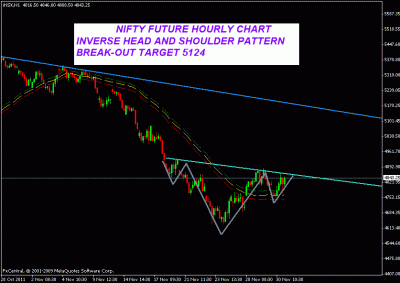
NOW NIFTY FUTURE HOURLY CHART FORMING INVERSE HEAD AND SHOULDER PATTERN BREAK OUT TARGET : 5124
| Description: |
|
| Filesize: |
17.39 KB |
| Viewed: |
466 Time(s) |
|
|
|
| Back to top |
|
 |
mahson
White Belt

Joined: 08 Aug 2009
Posts: 80
|
Post: #37  Posted: Mon Dec 05, 2011 6:47 am Post subject: Posted: Mon Dec 05, 2011 6:47 am Post subject: |
 |
|
NIFTY FUTURE TOUCH 5,094.00
I AM STILL WAITING FOR TARGET
|
|
| Back to top |
|
 |
mahson
White Belt

Joined: 08 Aug 2009
Posts: 80
|
Post: #38  Posted: Mon Dec 05, 2011 7:51 am Post subject: NIFTY FUTURE IMPORTANT LEVELS 05 DEC 2011 Posted: Mon Dec 05, 2011 7:51 am Post subject: NIFTY FUTURE IMPORTANT LEVELS 05 DEC 2011 |
 |
|
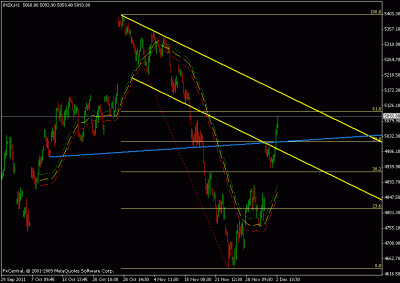
NIFTY FUTURE IMPORTANT LEVELS 05 DEC 2011
CHANNEL [ HOURLY CHART]
TREND WAVE RESISTANCE : 5161 - 5187
FIBONACCI RETRACEMENT
TRADING RESISTANCE : 5123 -5130.
POSITIVE BREAK OUT
TRADING SUPPORT : 5019 - 5036
CHANNEL [ HOURLY CHART]
TREND WAVE SUPPORT : 4993 -4977
-----------------------
NIFTY FUTURE INTRADAY TRADING LEVELS
NIFTY FUTURE BUY ABOVE : 5035
TARGETS : 5130 - 5189 - 5285.STOP LOSS 4998
NIFTY FUTURE SELL BELOW 4998
TARGETS : 4902 -4843 - 4747.STOP LOSS : 5035
------------------
| Description: |
|
| Filesize: |
15.38 KB |
| Viewed: |
443 Time(s) |
|
|
|
| Back to top |
|
 |
mahson
White Belt

Joined: 08 Aug 2009
Posts: 80
|
Post: #39  Posted: Mon Dec 05, 2011 3:23 pm Post subject: FRESH BREAK-OUT TARGET 5510 Posted: Mon Dec 05, 2011 3:23 pm Post subject: FRESH BREAK-OUT TARGET 5510 |
 |
|
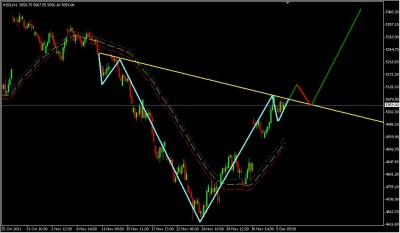
NIFTY FUTURE IF TRADE AND HOLD ABOVE 5080 THEN FRESH BREAK-OUT TARGET 5510
| Description: |
|
| Filesize: |
66.96 KB |
| Viewed: |
470 Time(s) |
|
|
|
| Back to top |
|
 |
vinay28
Black Belt

Joined: 24 Dec 2010
Posts: 11748
|
Post: #40  Posted: Mon Dec 05, 2011 3:32 pm Post subject: Posted: Mon Dec 05, 2011 3:32 pm Post subject: |
 |
|
| And target date? 23rd Dec?
|
|
| Back to top |
|
 |
mahson
White Belt

Joined: 08 Aug 2009
Posts: 80
|
Post: #41  Posted: Wed Dec 07, 2011 1:54 am Post subject: Posted: Wed Dec 07, 2011 1:54 am Post subject: |
 |
|
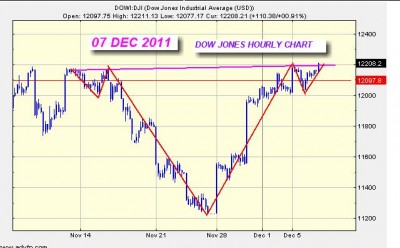
DOW JONES ~~ HOURLY CHART
| Description: |
|
| Filesize: |
43.39 KB |
| Viewed: |
459 Time(s) |
|
|
|
| Back to top |
|
 |
Team iCharts
White Belt

Joined: 08 Sep 2011
Posts: 119
|
Post: #42  Posted: Wed Dec 07, 2011 9:46 am Post subject: Final Warning Posted: Wed Dec 07, 2011 9:46 am Post subject: Final Warning |
 |
|
Dear Mahson,
This is to inform you that we have edited few of your recent chart image attachments to remove your website references. For some reason, you continue to violate our forum posting rules. You can consider this as the last warning (We have warned you before in this thread itself and earlier in your previous "avatar").
Any reference to your website in your postings will result in a permanent ban from forum for your current & any future login IDs.
Your understanding on this will be highly appreciated.
Thanks & Regards
Team iCharts
|
|
| Back to top |
|
 |
mahson
White Belt

Joined: 08 Aug 2009
Posts: 80
|
Post: #43  Posted: Sat Jan 21, 2012 1:55 pm Post subject: NIFTY FUTURE IMPORTANT LEVELS 23 JAN 2012 Posted: Sat Jan 21, 2012 1:55 pm Post subject: NIFTY FUTURE IMPORTANT LEVELS 23 JAN 2012 |
 |
|
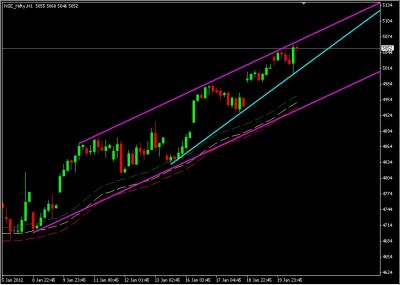
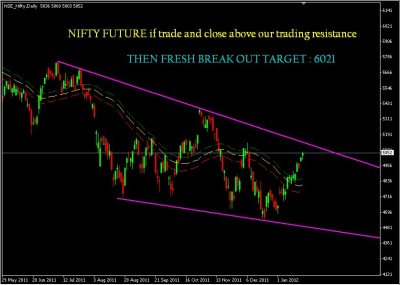
FALLING WEDGE PATTERN [ EOD ] TREND RESISTANCE 5122 - 5137
HOURLY CHART UP CHANNEL
TRADING RESISTANCE : 5071 -5078.
HOURLY CHART RAISING WEDGE PATTERN [ POSSIBLE ** ]
TRADING SUPPORT : 5028 - 5021.
HOURLY CHART : UP -SLOPING CHANNEL
TREND SUPPORT : 4969 - 4955.
----------------------
NIFTY FUTURE INTRADAY TRADING LEVELS.
NIFTY FUTURE BUY ABOVE : 5042
TARGETS : 5078 - 5101 - 5137.STOP LOSS : 5028.
NIFTY FUTURE SELL BELOW : 5028
TARGETS : 4992 - 4969 - 4933.STOP LOSS : 5042.
------------------------
NIFTY FUTURE POSITIONAL VIEW :-
TODAY NIFTY FUTURE FACE STRONG RESISTANCE AT OUR TREND RESISTANCE LEVELS.
INCASE IF TRADE AND HOLD ABOVE OUR TREND RESISTANCE THEN NIFTY FUTURE
FRESH BREAK OUT TARGET : 6021 [ TARGET TIME FRAME 3 -5 MONTHS ]
------------------------------
WHO ONE HOLD LONG AT OUR TRIGGER LEVEL KEEP STOP LOSS AT TRADING SUPPORT AREA. CANDLE CLOSING BASIS*** . ( HOURLY CHART RAISING WEDGE PATTERN [ POSSIBLE ** ] )
--------------------------------
| Description: |
|
| Filesize: |
52.75 KB |
| Viewed: |
455 Time(s) |
|
| Description: |
|
| Filesize: |
62.84 KB |
| Viewed: |
470 Time(s) |
|
|
|
| Back to top |
|
 |
ridinghood
Yellow Belt

Joined: 16 Apr 2009
Posts: 724
|
Post: #44  Posted: Sat Jan 21, 2012 7:52 pm Post subject: Posted: Sat Jan 21, 2012 7:52 pm Post subject: |
 |
|
welcome back mahson
regs
ridinghood
|
|
| Back to top |
|
 |
KatrinaaDP
White Belt

Joined: 11 Sep 2010
Posts: 95
|
Post: #45  Posted: Sat Jan 21, 2012 11:51 pm Post subject: Posted: Sat Jan 21, 2012 11:51 pm Post subject: |
 |
|
| mehson sir Great vergood explain
|
|
| Back to top |
|
 |
|

