|
|
| View previous topic :: View next topic |
| Author |
NIFTY FUTURE LEVELS |
mahson
White Belt

Joined: 08 Aug 2009
Posts: 80
|
Post: #1  Posted: Tue Nov 15, 2011 10:25 am Post subject: NIFTY FUTURE LEVELS Posted: Tue Nov 15, 2011 10:25 am Post subject: NIFTY FUTURE LEVELS |
 |
|


NIFTY FUTURE IMPORTANT LEVELS 15 NOV 2011
----------------------
MA BAND TREND RESISTANCE : 5252 - 5270
HEAD AND SHOULDER PATTERN NECKLINE
TRADING RESISTANCE : 5185 -5177.
PARALLEL LINE
TRADING SUPPORT : 5122 -5112
FIBO RETRACEMENT [ 50% ]
TREND SUPPORT : 5086 - 5073
-----------------------
NIFTY FUTURE INTRADAY TRADING LEVELS
NIFTY FUTURE BULLISH ABOVE : 5210
TARGETS : 5271 - 5310 - 5372.STOP LOSS 5186
NIFTY FUTURE BEARISH BELOW 5186
TARGETS : 5124 -5086 -5024.STOP LOSS : 5210
------------------
NIFTY FUTURE POSITIONAL VIEW
NIFTY FUTURE HOURLY CHART NOW FORMING "HEAD AND SHOULDER PATTERN ".NIFTY FUTURE ONCE TAKE RESISTANCE AT PATTERN NECK LINE THEN TAKE POSITION SHORT ENTRY WHO ONE MISS YESTERDAYS POSITIONAL SHORTS.
AS PER PATTERN BREAK-OUT TARGET IN DOWN SIDE : 4858.
POSITIONAL TRADERS KEEP STOP LOSS AT OUR TREND RESISTANCE.
-----------------
Trading Signals in head and shoulder pattern
Go short at breakout below the neckline.
Place a stop-loss just above the last peak.
After the breakout, price often rallies back to the neckline which then acts as a resistance level. Go short on a reversal signal and place a stop-loss one tick above the resistance level.

Never trust a head and shoulders pattern where the neckline is clearly ascending (the second trough being higher than the first). Also, the more level the neckline, the more reliable the pattern.
|
|
| Back to top |
|
 |
|
|  |
ongc123
White Belt

Joined: 02 Dec 2010
Posts: 75
|
Post: #2  Posted: Tue Nov 15, 2011 10:30 am Post subject: Posted: Tue Nov 15, 2011 10:30 am Post subject: |
 |
|
v nice broo keep it up 
|
|
| Back to top |
|
 |
bharatpatel
White Belt

Joined: 26 Oct 2011
Posts: 401
|
Post: #3  Posted: Tue Nov 15, 2011 10:53 am Post subject: hi Posted: Tue Nov 15, 2011 10:53 am Post subject: hi |
 |
|
Dear Mahson,
Really very nice work done. easy to understand. pls keep posting.
wish u all the best.
Happy Trading.
Bharat
|
|
| Back to top |
|
 |
mahson
White Belt

Joined: 08 Aug 2009
Posts: 80
|
Post: #4  Posted: Tue Nov 15, 2011 11:25 am Post subject: WOLF WAVE PATTERN Posted: Tue Nov 15, 2011 11:25 am Post subject: WOLF WAVE PATTERN |
 |
|
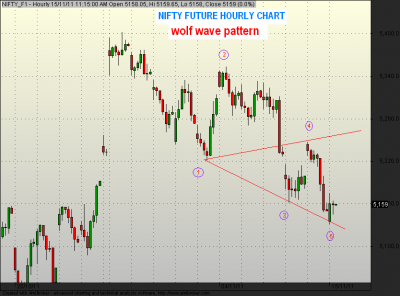
NIFTY HOURLY FUTURE CHART
WOLF WAVE PATTERN
| Description: |
|
| Filesize: |
28.73 KB |
| Viewed: |
967 Time(s) |
|
|
|
| Back to top |
|
 |
vinay28
Black Belt

Joined: 24 Dec 2010
Posts: 11748
|
Post: #5  Posted: Tue Nov 15, 2011 11:38 am Post subject: Posted: Tue Nov 15, 2011 11:38 am Post subject: |
 |
|
| Can't read Y axis to find target
|
|
| Back to top |
|
 |
mahson
White Belt

Joined: 08 Aug 2009
Posts: 80
|
|
| Back to top |
|
 |
mahson
White Belt

Joined: 08 Aug 2009
Posts: 80
|
Post: #7  Posted: Wed Nov 16, 2011 11:15 am Post subject: Two Bar Reversal (Bearish) Posted: Wed Nov 16, 2011 11:15 am Post subject: Two Bar Reversal (Bearish) |
 |
|
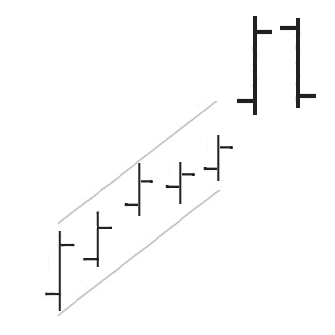
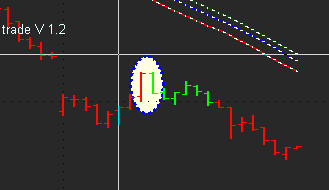
Two Bar Reversal (Bearish)
A Two Bar Reversal (Bearish) indicates a possible reversal of the current uptrend to a new downtrend. This pattern is an indication of a financial instrument's SHORT-TERM outlook. One and two-bar patterns reflect changes in investor psychology that have a very short-term influence on future prices - typically less than 10 bars. Often the immediate effect is trend reversal. For traders looking for clear entry and exit points, these patterns serve well. They are normally not suitable as signals for long-term investors unless viewed as monthly bars.
Description
A Two Bar Reversal is a classic signal of trend exhaustion. When these patterns occur after a pronounced advance or decline, the first bar should exhibit a dramatic continuation of the inbound trend, closing close to the bar's extreme end. The second bar completely negates the first bar, with the open price on the second bar being close to the close of the first bar and the close of the second bar being close to the open of the first bar. Wider trading ranges on both bars denote a more climactic reversal in psychology.
Trading Considerations
Two Bar Reversals can be either Bullish or Bearish depending on the direction of the inbound price trend. If the inbound trend is up, then upon identification of a Two Bar Reversal, taking a short position or selling a long position is recommended. Conversely, if the inbound price trend is down, then upon identification of a Two Bar Reversal, taking a long position or closing a short position is recommended.
The degree that the price bars and volume characteristics match this description will likely have a bearing on the strength of the post pattern price movement. Good trading practice dictates that these signals should not be used in isolation: fundamental data, sector and market indications and other technicals such as support/resistance and momentum studies should be used to support your trading decisions.
Criteria that Support
A persistent upward inbound trend is required; the longer and sharper, the better.
Both bars should have exceptionally wide trading ranges relative to the previous bars formed during the inbound trend.
For both bars, the opening and closing prices should be as close to the extreme points of the bars as possible.
Volume, if available, should be higher on both bars to accentuate the sentiment reversal. The greater the expansion of volume, the better the signal.
Underlying Behavior
Two Bar Reversals signal the dashing of hopes for those traders and investors that had been riding the trend or had jumped on board the especially wide trading of the pattern's first bar. The second bar, by completely reversing the ground made on the first bar, turns the tide of inbound sentiment and replaces it with an equal and opposite sentiment view. Look for an outbound trend period that reverses any gains made in the lead up to the Two Bar Reversal.
| Description: |
|
| Filesize: |
5.21 KB |
| Viewed: |
5916 Time(s) |
|
| Description: |
|
| Filesize: |
4.79 KB |
| Viewed: |
5918 Time(s) |
|
|
|
| Back to top |
|
 |
mahson
White Belt

Joined: 08 Aug 2009
Posts: 80
|
Post: #8  Posted: Thu Nov 17, 2011 8:31 am Post subject: NIFTY FUTURE IMPORTANT LEVELS 17 NOV 2011 Posted: Thu Nov 17, 2011 8:31 am Post subject: NIFTY FUTURE IMPORTANT LEVELS 17 NOV 2011 |
 |
|
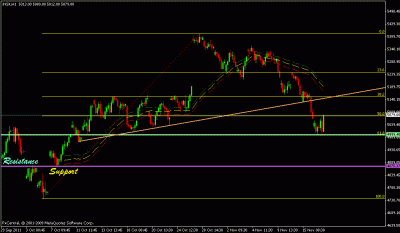
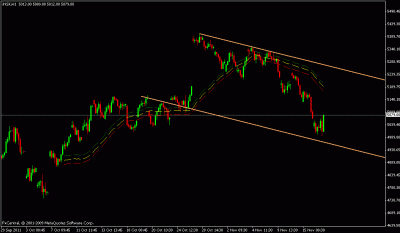
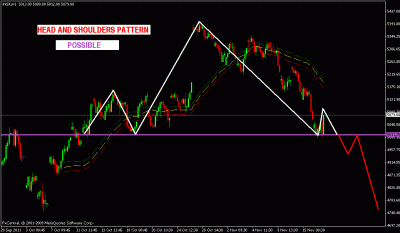
NIFTY FUTURE IMPORTANT LEVELS 17 NOV 2011
HOURLY CHART MA BAND
TREND RESISTANCE : 5186 - 5202
BREAK DOWN TRENDLINE
TRADING RESISTANCE : 5131 -5145.
DOWN CHANNEL PATTERN
TRADING SUPPORT : 4961 -4948
HORIZONTAL LINE SUPPORT AND RESISTANCE BASE
TREND SUPPORT : 4891-4875
-----------------------
NIFTY FUTURE INTRADAY TRADING LEVELS
NIFTY FUTURE BUY ABOVE : 5048
TARGETS : 5099 - 5131 - 5182.STOP LOSS 5028
NIFTY FUTURE SELL BELOW 5028
TARGETS : 4977 -4945 -4894.STOP LOSS : 5048
------------------
NIFTY FUTURE POSITIONAL VIEW
NIFTY FUTURE IF TRADE AND HOLD ABOVE OUR BUY TRIGGER POINT THEN BOOK 50 % SHORT POSITIONS HERE BALANCE HOLD WITH YOUR SHORT PRICE AS STOP LOSS.
WHO ONE BOOKED POSITIONAL SHORTS CAN TAKE FRESH SHORT POSITION ONLY BELOW OUR INTRA SELL TRIGGER POINT.
NIFTY FUTURE TRADE AND HOLD BELOW OUR TRADING SUPPORT LEVEL THEN FRESH BREAK DOWN TARGET 4602.
-----------------
Breakdown
What Does Breakdown Mean?
A price movement through an identified level of support, which is usually followed by heavy volume and sharp declines. Technical traders will short sell the underlying asset when the price of the security breaks below a support level because it is a clear indication that the bears are in control and that additional selling pressure is likely to follow.
Investopedia explains BreakdownTechnical tools such as moving averages, trendlines and chart patterns are the most common methods for technical traders to identify strong areas of support. The chart above shows that a trader will enter into a short position when the price breaks below an area of support (the thick dark line), which has been identified by using a head and shoulders chart pattern.
A breakdown is the bearish counterpart of a breakout
--------------------
| Description: |
|
| Filesize: |
15.19 KB |
| Viewed: |
434 Time(s) |
|
| Description: |
|
| Filesize: |
12.95 KB |
| Viewed: |
417 Time(s) |
|
| Description: |
|
| Filesize: |
17.77 KB |
| Viewed: |
449 Time(s) |
|
|
|
| Back to top |
|
 |
lambuhere1
White Belt

Joined: 06 Jul 2010
Posts: 26
|
Post: #9  Posted: Thu Nov 17, 2011 8:39 am Post subject: Posted: Thu Nov 17, 2011 8:39 am Post subject: |
 |
|
| Love the educational analysis sirji
|
|
| Back to top |
|
 |
mahson
White Belt

Joined: 08 Aug 2009
Posts: 80
|
Post: #10  Posted: Thu Nov 17, 2011 11:58 am Post subject: Gaps To Capture Posted: Thu Nov 17, 2011 11:58 am Post subject: Gaps To Capture |
 |
|
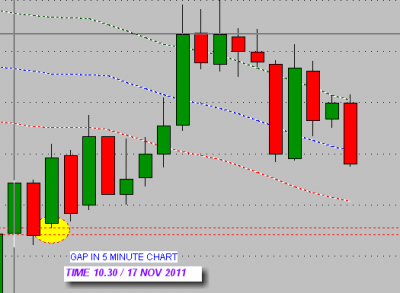
Gaps To Capture
| Description: |
|
| Filesize: |
14.54 KB |
| Viewed: |
457 Time(s) |
|
|
|
| Back to top |
|
 |
mahson
White Belt

Joined: 08 Aug 2009
Posts: 80
|
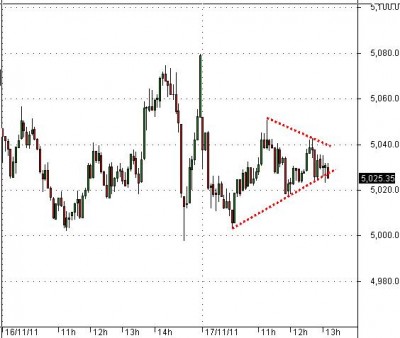
Post: #11  Posted: Thu Nov 17, 2011 1:27 pm Post subject: The Formation of Bearish Pennant Pattern Posted: Thu Nov 17, 2011 1:27 pm Post subject: The Formation of Bearish Pennant Pattern |
 |
|
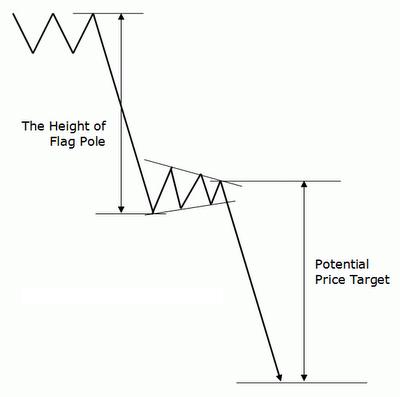
The Formation of Bearish Pennant Pattern
Bearish Pennant pattern is usually preceded by a very steep (almost vertical) decrease in price on heavy volume. This steep price decrease makes the “Flagpole” of the pattern.
The sharp decline in price may occur due to negative market sentiments toward unfavorable events / developments, such as negative earning surprises, downward guidance, fraud / court cases, etc.
After the sharp decrease, the price movement is then contained within two converging lines (wide in the beginning and narrowing as the pattern develops), forming a small symmetric triangle / “Pennant” shape, on decreasing volume.
The slope of the Pennant is usually neutral.
This pennant represents a brief pause / consolidation in the midst of a downtrend before resuming its downward movement.
The completion of the pattern occurs when prices break to the downside through the support level (i.e. lower ascending line) of the Pennant with a spike in volume. This would mark the resumption of the original downtrend.
The Psychology Behind Bearish Pennant Pattern
A Bearish Pennant pattern takes place because prices seldom decline sharply in a straight line for an extended period. Hence, during a sharp price movement, prices will typically take brief pause periods to "catch their breath" before continuing their move.
During the 1st stage of the Bearish Pennant pattern (Flagpole part), as a result of negative market reactions toward some unfavorable events / developments (e.g. negative earnings surprises, downward guidance, etc.), prices keep on dropping sharply as nervous sellers and new short sellers who were caught-up in the euphoria at that moment, are willing to sell at even lower prices.
As the prices drop, some early sellers who have sold short the stock at higher levels would begin to cover their short position. In addition, some investors might also start bargain-hunting. At this point, the 2nd stage of the Bearish Pennant pattern begins (i.e. the Pennant part).
At first, most of the stocks bought by the early sellers were easily absorbed by nervous new sellers, since the news and market sentiments are still very negative. Nevertheless, as time passes, the selling pressures subside and prices begin to consolidate on a decreasing volume.
After some time, new negative news come out. As a result, the price begin to collapse again and break out through the lower line of the Pennant with a surge in volume, as new sellers now overwhelm those bargain hunting.
In the following days, there might be some more unfavorable news / comments or less optimistic earnings forecast coming, leading the prices to drop even lower.
| Description: |
|
| Filesize: |
11.11 KB |
| Viewed: |
4212 Time(s) |
|
| Description: |
|
| Filesize: |
40.43 KB |
| Viewed: |
434 Time(s) |
|
|
|
| Back to top |
|
 |
vinay28
Black Belt

Joined: 24 Dec 2010
Posts: 11748
|
Post: #12  Posted: Thu Nov 17, 2011 1:37 pm Post subject: Posted: Thu Nov 17, 2011 1:37 pm Post subject: |
 |
|
| Ready for a fall, final one, I hope, for the month
|
|
| Back to top |
|
 |
vinay28
Black Belt

Joined: 24 Dec 2010
Posts: 11748
|
Post: #13  Posted: Thu Nov 17, 2011 2:15 pm Post subject: Posted: Thu Nov 17, 2011 2:15 pm Post subject: |
 |
|
| Waiting for 4948 to enter long
|
|
| Back to top |
|
 |
lambuhere1
White Belt

Joined: 06 Jul 2010
Posts: 26
|
Post: #14  Posted: Thu Nov 17, 2011 2:34 pm Post subject: Posted: Thu Nov 17, 2011 2:34 pm Post subject: |
 |
|
| Beautifully explained. Liked it.
|
|
| Back to top |
|
 |
satishkadam
Yellow Belt

Joined: 01 Apr 2010
Posts: 805
|
Post: #15  Posted: Thu Nov 17, 2011 3:55 pm Post subject: Posted: Thu Nov 17, 2011 3:55 pm Post subject: |
 |
|
| vinay28 wrote: | | Waiting for 4948 to enter long |
Did u buy at 4948,,, or we expecting further. fall till 4720.......
 
|
|
| Back to top |
|
 |
|
|
You cannot post new topics in this forum
You cannot reply to topics in this forum
You cannot edit your posts in this forum
You cannot delete your posts in this forum
You cannot vote in polls in this forum
You can attach files in this forum
You can download files in this forum
|
Powered by phpBB © 2001, 2005 phpBB Group
|
|
|

