| View previous topic :: View next topic |
| Author |
Nifty long term pivots and thoughts |
Speculator
Expert

Joined: 15 Apr 2008
Posts: 149
|
Post: #1  Posted: Fri Jun 10, 2011 9:03 pm Post subject: Nifty long term pivots and thoughts Posted: Fri Jun 10, 2011 9:03 pm Post subject: Nifty long term pivots and thoughts |
 |
|
I just wanted to update the EOD pivots on Nifty, as a brain exercise for myself and at the same time provide a long term picture of the market from my Pivot system perspective.
Just to be clear this is not a forecast as i don't predict anything about the future, nor is it any analysis as that would imply that there would be conclusions. It's just observation based on my system and classical TA.
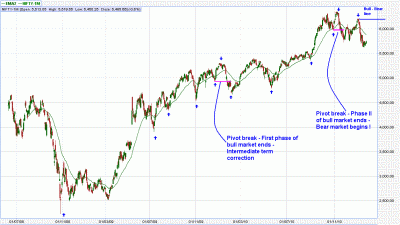
As we can see from the second chart, Jan 2010 was the first time the pivot broke on the daily charts. That concluded the first phase of the bull market and an intermediate term correction followed. Phase II of bull concluded when the 5966 pivot broke in Nov 2010. Since then we have been in a bear market. From the pivot system perspective, until 6210 pivot is taken out, we will continue to remain in a long term downtrend a.k.a bear market. A break above 6210 would mean a resumption of the bull market and then we would be in uncharted territory, where "Sky is the limit" 
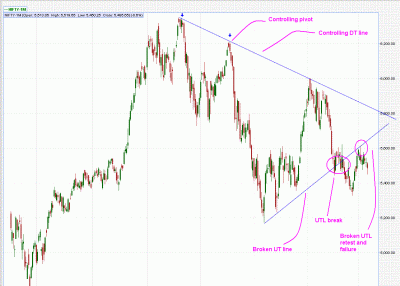
From a classical trendline analysis perspective (shown in the first chart), the bear rally from Feb 2011 lows, got rejected from the controlling DT line at NF 6000. It subsequently broke the uptrend line in May 2011 and a retest failure occurred in June 2011. Now in order for any bull move to occur, we need to move thru layers and layers of resistance. First we need to recapture the broken UTL, then break the DTL and then break the controlling pivot at 6210. Not an impossible task. But a lot of long term investors are trapped in this decline and there would be significant overhead selling we move up these resistances. The big question as always is "Where will all the money come from to break thru those barriers in a tightening monetary policy accross the globe?"  Time will tell..... Time will tell.....
I will update this thread again when something of Long term significance happens.
- Speculator
| Description: |
|
| Filesize: |
42.63 KB |
| Viewed: |
934 Time(s) |

|
| Description: |
|
| Filesize: |
34.12 KB |
| Viewed: |
869 Time(s) |

|
Last edited by Speculator on Sat Jun 11, 2011 1:05 am; edited 1 time in total |
|
| Back to top |
|
 |
|
|
 |
vinst
Black Belt

Joined: 09 Jan 2007
Posts: 3303
|
Post: #2  Posted: Fri Jun 10, 2011 9:37 pm Post subject: Posted: Fri Jun 10, 2011 9:37 pm Post subject: |
 |
|
Hi Spec,
Thanks for posting your analysis on daily TF which nicely simulates behaviour of weekly pure pivots .
I greatly appreciate your work.
regard,
vin
|
|
| Back to top |
|
 |
ronypan
White Belt

Joined: 07 Aug 2010
Posts: 197
|
Post: #3  Posted: Fri Jun 10, 2011 9:40 pm Post subject: Posted: Fri Jun 10, 2011 9:40 pm Post subject: |
 |
|
| Thanks Sirji..
|
|
| Back to top |
|
 |
ashis
White Belt

Joined: 28 Mar 2010
Posts: 75
|
Post: #4  Posted: Fri Jun 10, 2011 9:52 pm Post subject: Re: Nifty long term pivots and thoughts Posted: Fri Jun 10, 2011 9:52 pm Post subject: Re: Nifty long term pivots and thoughts |
 |
|
Dear Speculator sir,
Realy great work.
Surely it will be helpful for long term investors.
regards
Ashis
|
|
| Back to top |
|
 |
Arul Zen
White Belt

Joined: 23 Jan 2008
Posts: 38
|
Post: #5  Posted: Sat Jun 11, 2011 12:29 am Post subject: Posted: Sat Jun 11, 2011 12:29 am Post subject: |
 |
|
spec., Thanks for the post..btw wasn't it the pivot was 5966 when price breached in nov 2010?
Thanks and regards
Arul
|
|
| Back to top |
|
 |
Speculator
Expert

Joined: 15 Apr 2008
Posts: 149
|
Post: #6  Posted: Sat Jun 11, 2011 1:06 am Post subject: Posted: Sat Jun 11, 2011 1:06 am Post subject: |
 |
|
| Quote: | spec., Thanks for the post..btw wasn't it the pivot was 5966 when price breached in nov 2010?
Thanks and regards
Arul |
Sorry, my mistake. Yes it was 5966. I just corrected my original post.
|
|
| Back to top |
|
 |
Shahii
White Belt

Joined: 15 Apr 2011
Posts: 46
|
|
| Back to top |
|
 |
sandew
White Belt

Joined: 02 Feb 2009
Posts: 174
|
Post: #8  Posted: Sat Jun 11, 2011 11:31 pm Post subject: Hi Posted: Sat Jun 11, 2011 11:31 pm Post subject: Hi |
 |
|
Hi Spec,
This I fathom is what you might have narrated in the meeting at Bangalore which Rainbow organised, and I missed - about the daily set up.
what ema / ma is plotted on the eod nifty, please
|
|
| Back to top |
|
 |
Speculator
Expert

Joined: 15 Apr 2008
Posts: 149
|
Post: #9  Posted: Sun Jun 12, 2011 3:49 pm Post subject: Posted: Sun Jun 12, 2011 3:49 pm Post subject: |
 |
|
sandew,
What we discussed in Bangalore icharts meet was different.
What i have shown in this EOD charts is based on 34 ema pivots.
-Speculator
|
|
| Back to top |
|
 |
OldMonk
White Belt

Joined: 10 Jun 2011
Posts: 2
|
Post: #10  Posted: Thu Jun 16, 2011 5:17 pm Post subject: Posted: Thu Jun 16, 2011 5:17 pm Post subject: |
 |
|
amazing work by spec as always!!!!
Many thanks
Oldmonk
|
|
| Back to top |
|
 |
vinay28
Black Belt

Joined: 24 Dec 2010
Posts: 11748
|
Post: #11  Posted: Thu Jun 16, 2011 8:03 pm Post subject: Posted: Thu Jun 16, 2011 8:03 pm Post subject: |
 |
|
Dear Speculator
As a novice, trying to learn something, I did nifty trend for a longer past period considering symmetrical triangle and I uploading it though I don't know how to interpret it. Can you advice?
| Description: |
|

Download |
| Filename: |
Nifty-10Jun.pdf |
| Filesize: |
661.85 KB |
| Downloaded: |
605 Time(s) |
|
|
| Back to top |
|
 |
mdismail777
White Belt

Joined: 03 Jul 2011
Posts: 2
|
Post: #12  Posted: Sat Jul 09, 2011 3:23 am Post subject: hi Posted: Sat Jul 09, 2011 3:23 am Post subject: hi |
 |
|
hello guys i am from bangalore, working in dubai. i am trying to learn the stock market. I found the speculator has done great job in teaching others. good luck. 
|
|
| Back to top |
|
 |
infinity
White Belt

Joined: 09 Aug 2010
Posts: 49
|
Post: #13  Posted: Thu Aug 04, 2011 10:53 pm Post subject: Re: Nifty long term pivots and thoughts Posted: Thu Aug 04, 2011 10:53 pm Post subject: Re: Nifty long term pivots and thoughts |
 |
|
Spec sir,
While reading your SB comments; I reached this thread & then I was referring to weekly historical charts of S&P. I noticed similar pattern in S&P during week starting 28th Jun'10 when "Pivot break" happened which was may be first phase of bull market. & Phase II happened yesterday.
 for sharing your observation. for sharing your observation.
with warm regards,
anant
| Speculator wrote: | I just wanted to update the EOD pivots on Nifty, as a brain exercise for myself and at the same time provide a long term picture of the market from my Pivot system perspective.
Just to be clear this is not a forecast as i don't predict anything about the future, nor is it any analysis as that would imply that there would be conclusions. It's just observation based on my system and classical TA.
As we can see from the second chart, Jan 2010 was the first time the pivot broke on the daily charts. That concluded the first phase of the bull market and an intermediate term correction followed. Phase II of bull concluded when the 5966 pivot broke in Nov 2010. Since then we have been in a bear market. From the pivot system perspective, until 6210 pivot is taken out, we will continue to remain in a long term downtrend a.k.a bear market. A break above 6210 would mean a resumption of the bull market and then we would be in uncharted territory, where "Sky is the limit" 
From a classical trendline analysis perspective (shown in the first chart), the bear rally from Feb 2011 lows, got rejected from the controlling DT line at NF 6000. It subsequently broke the uptrend line in May 2011 and a retest failure occurred in June 2011. Now in order for any bull move to occur, we need to move thru layers and layers of resistance. First we need to recapture the broken UTL, then break the DTL and then break the controlling pivot at 6210. Not an impossible task. But a lot of long term investors are trapped in this decline and there would be significant overhead selling we move up these resistances. The big question as always is "Where will all the money come from to break thru those barriers in a tightening monetary policy accross the globe?"  Time will tell..... Time will tell.....
I will update this thread again when something of Long term significance happens.
- Speculator |

|
|
| Back to top |
|
 |
Arul Zen
White Belt

Joined: 23 Jan 2008
Posts: 38
|
Post: #14  Posted: Tue Aug 09, 2011 6:30 pm Post subject: Posted: Tue Aug 09, 2011 6:30 pm Post subject: |
 |
|
| From now on 6000 is our long term down swing pivot...
|
|
| Back to top |
|
 |
Speculator
Expert

Joined: 15 Apr 2008
Posts: 149
|
|
| Back to top |
|
 |
|

