| View previous topic :: View next topic |
| Author |
Nifty looks good to breakout (At least TA suggests that) |
ipakrashi
White Belt

Joined: 09 Jul 2009
Posts: 16
|
Post: #1  Posted: Tue Jul 28, 2009 12:47 am Post subject: Nifty looks good to breakout (At least TA suggests that) Posted: Tue Jul 28, 2009 12:47 am Post subject: Nifty looks good to breakout (At least TA suggests that) |
 |
|
hi
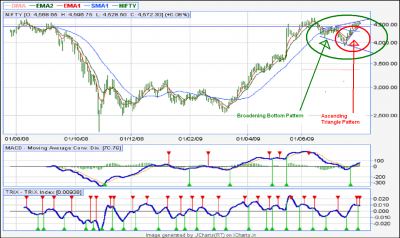
I was going thru the Nifty patterns and i find that nifty is poised for a good breakout, there is no need for a panic that a fall is imminent, Please go thru the attached charts which show 2 bullish pattern formations.
The one encircled in red is the ascending triangle formation which is inherently bullish which makes Nifty poised for a major breakout
The second pattern is a bit old, Encircled in green which shows early signs of a broadening bottom, which again is a bullish formation.
Thirdly the FII s have been net buyers on 24th July suggesting that there is more momentum left in the nifty.
Only sad thing is that Reliance Ind has posted weak numbers, I guess that is temporary cos TA and the price would factor the weak set of numbers.
So guys trade happily without Fear as the nifty is poised for a breakout.
I would ask the moderator to evaluate my analysis and comment on the same, this is for the person nicknamed "Swing Trader"
Regards
Indranil
| Description: |
|
| Filesize: |
184.06 KB |
| Viewed: |
724 Time(s) |
|
|
|
| Back to top |
|
 |
|
| |
Class
White Belt
Joined: 07 May 2008
Posts: 11
|
| Post: #2 Posted: Tue Jul 28, 2009 8:05 pm Post subject: |
|
|
Hi ipakrashi,
May I comment. I'm not familiar with the broadening bottom pattern, but I thought that a rising triangle is formed with the highs at approximately the same level, resisitance, and the lows rising to form the ascending triangle.
If anything what you have circled in green could be the beginning of an inverted head and shoulders pattern with the first shoulder and head in place. Also bullish if we get the second shoulder. Let me know if you see the same thing.
All the best,
Regards,
Class.
|
|
| Back to top |
|
|
ipakrashi
White Belt
Joined: 09 Jul 2009
Posts: 16
|
| Post: #3 Posted: Tue Jul 28, 2009 11:49 pm Post subject: |
|
|
hi class
Yes you are right... Its early days of Inverted head & shoulders.
Whatever said and done as per the charts the nifty looks good and poised for a breakout
Thanks buddy
Indranil
|
|
| Back to top |
|
|
|
|
You cannot post new topics in this forum
You cannot reply to topics in this forum
You cannot edit your posts in this forum
You cannot delete your posts in this forum
You cannot vote in polls in this forum
You can attach files in this forum
You can download files in this forum
|
Powered by phpBB © 2001, 2005 phpBB Group
|
|


