| View previous topic :: View next topic |
| Author |
Nifty Multiple Moving Averages |
Gemini
White Belt

Joined: 28 Apr 2009
Posts: 166
|
Post: #1  Posted: Mon Jul 02, 2012 1:46 pm Post subject: Nifty Multiple Moving Averages Posted: Mon Jul 02, 2012 1:46 pm Post subject: Nifty Multiple Moving Averages |
 |
|
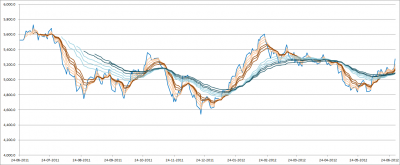
Sharing the chart prepared through calculations on Excel for reference and study....
Looks Nifty has now entered bullish phase ...
| Description: |
|
| Filesize: |
98.67 KB |
| Viewed: |
815 Time(s) |
|
|
|
| Back to top |
|
 |
|
| |
Gemini
White Belt
Joined: 28 Apr 2009
Posts: 166
|
| Post: #2 Posted: Sun Jul 15, 2012 7:28 pm Post subject: |
|
|
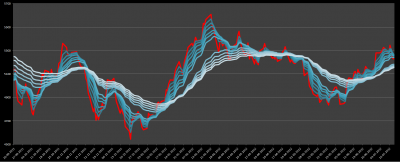
Sharing the chart for ref and study...
| Description: |
|
| Filesize: |
170.41 KB |
| Viewed: |
666 Time(s) |
|
|
|
| Back to top |
|
|
sherbaaz
Yellow Belt

Joined: 27 May 2009
Posts: 543
|
| Post: #3 Posted: Mon Jul 16, 2012 10:16 pm Post subject: |
|
|
| Gemini wrote: | | Sharing the chart for ref and study... |
Hi,
What should one study in the picture which is of modified GAMMA??
Explain how to look into these MA's, which tells the inferred activities of short term traders and long term investors.
How u interpret the activities of both the groups, kindly explain, Else picture will be of no use if u dont put some analysis of yr own.
regds,
|
|
| Back to top |
|
|
sonila
Brown Belt

Joined: 04 Jun 2009
Posts: 1786
|
| Post: #4 Posted: Mon Jul 16, 2012 10:52 pm Post subject: |
|
|
| Yes, difficult to understand.
|
|
| Back to top |
|
|
|
|
You cannot post new topics in this forum
You cannot reply to topics in this forum
You cannot edit your posts in this forum
You cannot delete your posts in this forum
You cannot vote in polls in this forum
You can attach files in this forum
You can download files in this forum
|
Powered by phpBB © 2001, 2005 phpBB Group
|
|


