| View previous topic :: View next topic |
| Author |
NIFTY - only Charts [TA] |
amitagg
Black Belt

Joined: 01 Oct 2013
Posts: 4559
|
Post: #1  Posted: Sat Feb 08, 2014 1:31 pm Post subject: NIFTY - only Charts [TA] Posted: Sat Feb 08, 2014 1:31 pm Post subject: NIFTY - only Charts [TA] |
 |
|
This new topic is only for summation of Nifty ideas through posting charts and TA. [not intended for general views , discussion but specific Nifty "Chart" related ideas and views.
The intention is
- to not forget longer term charts for Nifty in the maze of daily trading and monthly nifty forum.....
- and also to follow strategies elsewhere posted in icharts thru chart patterns....
- so that all Nifty views through charts are captured in one thread
This is for all ichartians and feel free to post charts and express visual ideas....
I would suggest that in absence of chart, ideas can be posted in regular Nifty thread.....also follow up discussion and contra views etc can be undertaken in this thread even without charts....
since objective is to post charts, EOD would usually be the time for postings but everyone is welcome to post "Only Nifty Charts" any time any where..... 
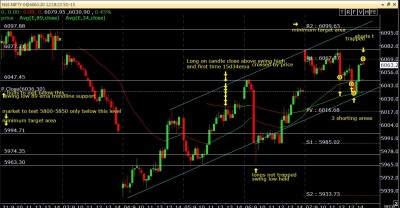
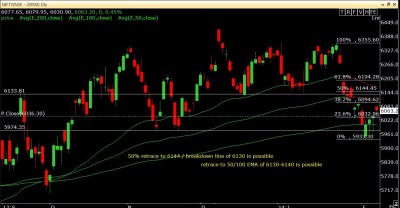
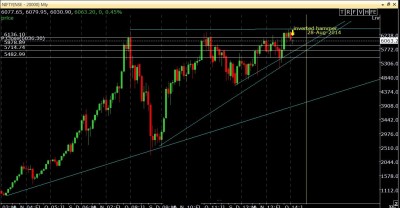
[starting with some charts following the 3 posted lately in "Read the Line thread"]
Regards
Amit Agg
| Description: |
|
| Filesize: |
258.34 KB |
| Viewed: |
581 Time(s) |
|
| Description: |
|
| Filesize: |
203.9 KB |
| Viewed: |
544 Time(s) |
|
| Description: |
|
| Filesize: |
189.21 KB |
| Viewed: |
548 Time(s) |
|
|
|
| Back to top |
|
 |
|
|
 |
vinay28
Black Belt

Joined: 24 Dec 2010
Posts: 11748
|
Post: #2  Posted: Sat Feb 08, 2014 3:41 pm Post subject: Posted: Sat Feb 08, 2014 3:41 pm Post subject: |
 |
|
| I don't know whether this comment of mine comes under the purview of this thread. The level of about 5700 is possible in Feb itself if nifty gives a daily close below 5931 very soon, otherwise if it is delayed by some days, may be 5900 in feb and 5700 in early March. I wonder why it should take a long time i.e. in August, unless it is going to go up much more in a few months first. On the upper side, I will give comment in "nifty-feb" thread as posted elsewhere.
|
|
| Back to top |
|
 |
rk_a2003
Black Belt

Joined: 21 Jan 2010
Posts: 2734
|
Post: #3  Posted: Sat Feb 08, 2014 5:13 pm Post subject: Posted: Sat Feb 08, 2014 5:13 pm Post subject: |
 |
|
This is the right approach, coming down from monthly charts. It's really a use full thread. Amit, you should have posted a weekly chart as well. 
|
|
| Back to top |
|
 |
amitagg
Black Belt

Joined: 01 Oct 2013
Posts: 4559
|
Post: #4  Posted: Sun Feb 09, 2014 3:39 pm Post subject: Posted: Sun Feb 09, 2014 3:39 pm Post subject: |
 |
|
| vinay28 wrote: | | I don't know whether this comment of mine comes under the purview of this thread. The level of about 5700 is possible in Feb itself if nifty gives a daily close below 5931 very soon, otherwise if it is delayed by some days, may be 5900 in feb and 5700 in early March. I wonder why it should take a long time i.e. in August, unless it is going to go up much more in a few months first. On the upper side, I will give comment in "nifty-feb" thread as posted elsewhere. |
i agree Vinay, could not post lot analysis in chart itself, but seeing chart, 5500 is possible in Feb if a vertical breakdown [only technical possibility i dont think it shall happen], Aug was just tentative, suggesting that if market is above 5700 or more by August even after falling to 5500 in Feb, "long term bullish trendline" would not be broken......thats most important from EW analysis that the yearly long term trendline is not broken........
|
|
| Back to top |
|
 |
amitagg
Black Belt

Joined: 01 Oct 2013
Posts: 4559
|
Post: #5  Posted: Mon Feb 10, 2014 4:39 am Post subject: Posted: Mon Feb 10, 2014 4:39 am Post subject: |
 |
|
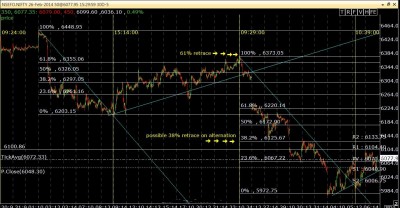
Another NF chart to use....see the
- classic fibo of downmove....
- channel resistances and supports holding....+ the parallels working
- lower channel line uptrend holding would mean bullish intact....currently at 6040NF
...most important see the "time interval" of 9-10 between tops and bottoms....the uptrend [sideways action] can last few weeks....i dont expect 6000 to be broken this month decisively...
5945 is 1.618 of down from 6450-6200.... and then rise to 6350 to fall to 5950...
| Description: |
|
| Filesize: |
289.91 KB |
| Viewed: |
529 Time(s) |
|
|
|
| Back to top |
|
 |
vinay28
Black Belt

Joined: 24 Dec 2010
Posts: 11748
|
Post: #6  Posted: Mon Feb 10, 2014 8:25 am Post subject: Posted: Mon Feb 10, 2014 8:25 am Post subject: |
 |
|
| since aug '13, barring one exception in Jan '14, each rally in nifty has been 61.8% of previous one and each fall has been 80% of previous fall. You can now do further calculation to see where it will reverse if this trend continues. Actually, the failure in Jan '14 may have given signals but it needs to give further confirmation by not following this trend.
|
|
| Back to top |
|
 |
amitagg
Black Belt

Joined: 01 Oct 2013
Posts: 4559
|
Post: #7  Posted: Mon Feb 10, 2014 8:48 am Post subject: Posted: Mon Feb 10, 2014 8:48 am Post subject: |
 |
|
| ok the below chart was to show minimum retrace of 6121/6125 future...38.2%....while fibos are sacrosanct, but the principle of alternation is necessarily not, and hence 6142 and 6170 are also possible....
|
|
| Back to top |
|
 |
amitagg
Black Belt

Joined: 01 Oct 2013
Posts: 4559
|
Post: #8  Posted: Wed Feb 12, 2014 10:33 am Post subject: Posted: Wed Feb 12, 2014 10:33 am Post subject: |
 |
|
| amitagg wrote: | | ok the below chart was to show minimum retrace of 6121/6125 future...38.2%....while fibos are sacrosanct, but the principle of alternation is necessarily not, and hence 6142 and 6170 are also possible.... |
chart effect   shorters were getting trapped on the way....upside now very limited...intra shorts for 10-15 points around 6120 are welcome.... shorters were getting trapped on the way....upside now very limited...intra shorts for 10-15 points around 6120 are welcome....
[my trade was not on Nifty but Reliance....only gaining 30% in one day]
|
|
| Back to top |
|
 |
amitagg
Black Belt

Joined: 01 Oct 2013
Posts: 4559
|
|
| Back to top |
|
 |
amitagg
Black Belt

Joined: 01 Oct 2013
Posts: 4559
|
Post: #10  Posted: Wed Feb 12, 2014 2:09 pm Post subject: Posted: Wed Feb 12, 2014 2:09 pm Post subject: |
 |
|
updated chart attached NF sustaining below 6095 shall be bearish......
| Description: |
|
| Filesize: |
217.79 KB |
| Viewed: |
467 Time(s) |

|
|
|
| Back to top |
|
 |
amitagg
Black Belt

Joined: 01 Oct 2013
Posts: 4559
|
Post: #11  Posted: Thu Feb 13, 2014 3:20 pm Post subject: Posted: Thu Feb 13, 2014 3:20 pm Post subject: |
 |
|
| amitagg wrote: | | updated chart attached NF sustaining below 6095 shall be bearish...... |
this was posted just before the fall yesterday...lower target of 6000 being reached.....
|
|
| Back to top |
|
 |
amitagg
Black Belt

Joined: 01 Oct 2013
Posts: 4559
|
Post: #12  Posted: Thu Feb 13, 2014 3:26 pm Post subject: Posted: Thu Feb 13, 2014 3:26 pm Post subject: |
 |
|
as estimated, fibo projection of alternate count of 38.2% retrace held good as NF touched 6123....
now, possible fall to 5994 was shown in chart below ......the gap support area....
nifty below this shall target 5940.....and make a bottom there again.....to rise .....so this month below 5900 is not expected for me....
considering time factor.....
| amitagg wrote: | Another NF chart to use....see the
- classic fibo of downmove....
- channel resistances and supports holding....+ the parallels working
- lower channel line uptrend holding would mean bullish intact....currently at 6040NF
...most important see the "time interval" of 9-10 between tops and bottoms....the uptrend [sideways action] can last few weeks....i dont expect 6000 to be broken this month decisively...
5945 is 1.618 of down from 6450-6200.... and then rise to 6350 to fall to 5950... |
|
|
| Back to top |
|
 |
amitagg
Black Belt

Joined: 01 Oct 2013
Posts: 4559
|
Post: #13  Posted: Sun Feb 23, 2014 10:43 am Post subject: Posted: Sun Feb 23, 2014 10:43 am Post subject: |
 |
|
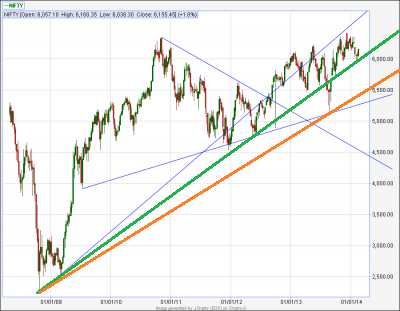
posting amended chart given by Vinay....see the green and orange trendline...and take a call which one is valid......as per TA analysis, very important that long term trendline has to be breached for bear phase [long term], i would take orange one as valid.....
| Description: |
|
| Filesize: |
48.82 KB |
| Viewed: |
478 Time(s) |
|
|
|
| Back to top |
|
 |
amitagg
Black Belt

Joined: 01 Oct 2013
Posts: 4559
|
Post: #14  Posted: Tue Feb 25, 2014 11:38 am Post subject: Posted: Tue Feb 25, 2014 11:38 am Post subject: |
 |
|
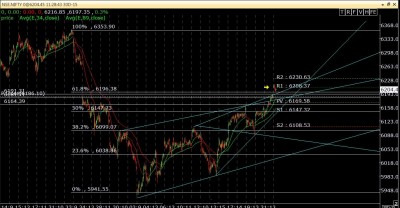
see the intra chart NS today at 11.30
- 34ema 15tf support at 6181
- -ve ww 15th if breaches 6191 below..
- ascending triangle faliure of breach if falls below 6180-6190....
hence....6180-6190 is support....market to touch 6150 below..holding 6180 can touch 6268 [1.618 of previous wave]
| Description: |
|
| Filesize: |
263.5 KB |
| Viewed: |
499 Time(s) |
|
|
|
| Back to top |
|
 |
amitagg
Black Belt

Joined: 01 Oct 2013
Posts: 4559
|
Post: #15  Posted: Tue Mar 04, 2014 7:28 pm Post subject: Posted: Tue Mar 04, 2014 7:28 pm Post subject: |
 |
|
| amitagg wrote: | | posting amended chart given by Vinay....see the green and orange trendline...and take a call which one is valid......as per TA analysis, very important that long term trendline has to be breached for bear phase [long term], i would take orange one as valid..... |
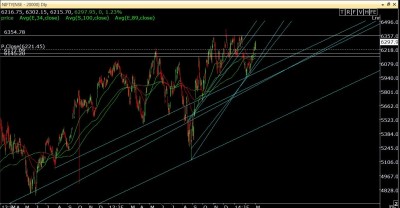
Nifty took support from green trendline and rising - new chart posted
see how the rise from 6220 changed the picture....its an important day today....see also the channel supports and resistance above 6357 meaning it shal be touched on spot....that is also multi month weekly resistance point.....
| Description: |
|
| Filesize: |
228.04 KB |
| Viewed: |
469 Time(s) |
|
|
|
| Back to top |
|
 |
|

