| View previous topic :: View next topic |
| Author |
Nifty Trade Log for Today |
anshuman
White Belt

Joined: 19 Jan 2009
Posts: 41
|
Post: #16  Posted: Mon Mar 23, 2009 8:59 pm Post subject: So much in so little time :) Posted: Mon Mar 23, 2009 8:59 pm Post subject: So much in so little time :) |
 |
|
Todays Trade:
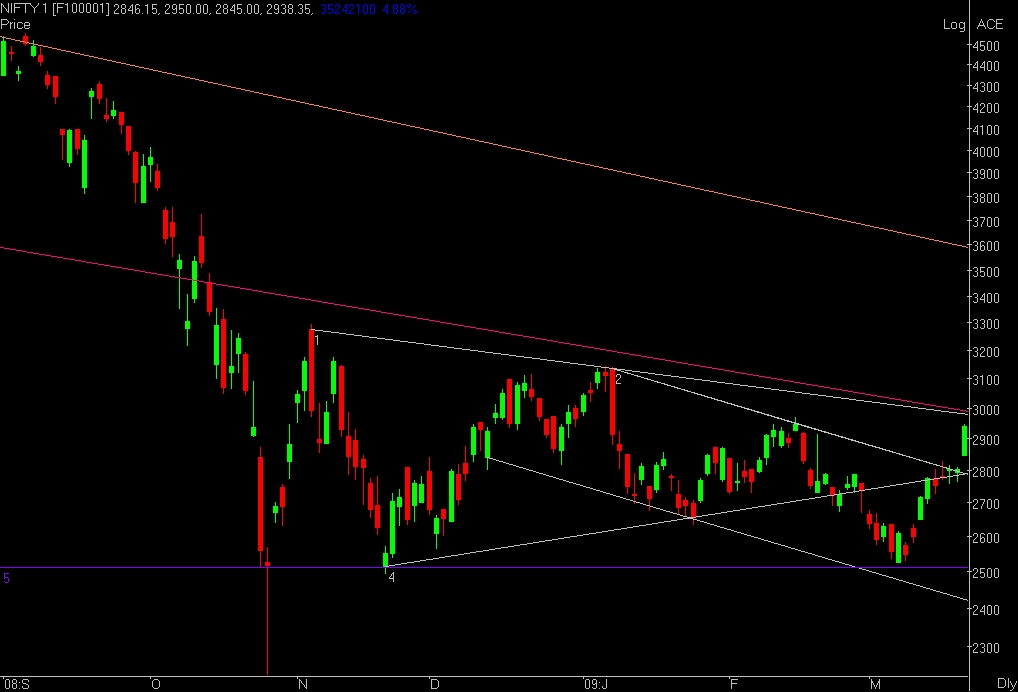
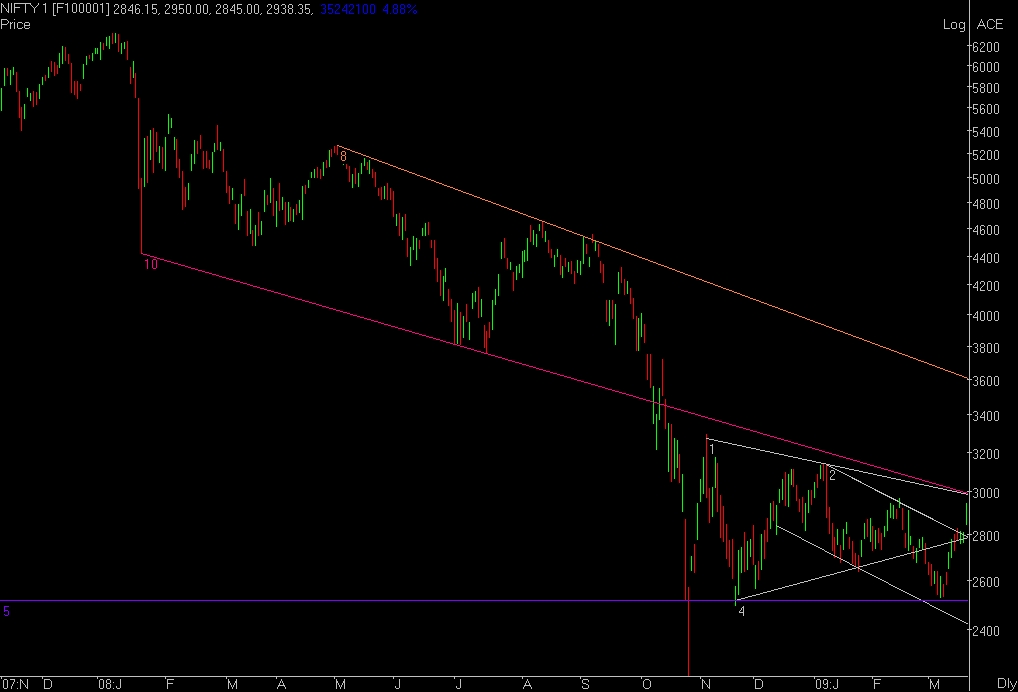
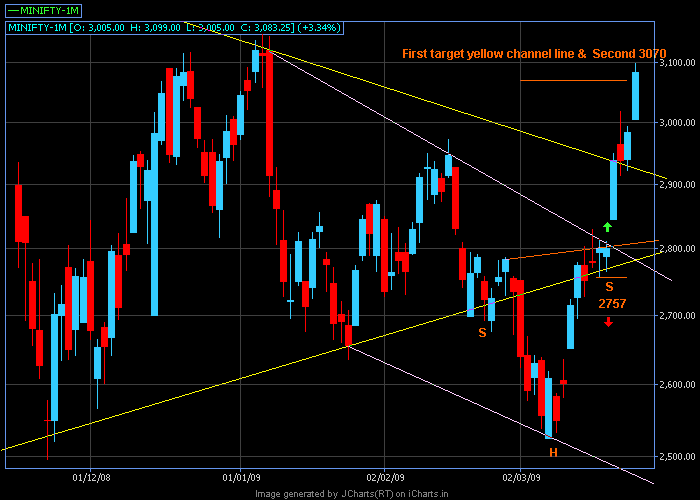
Our first target the yellow trendline was hit today, next we are waiting for 3070. Today was a no brainer. IH&S and Triangle breakout as plotted yesterday. Buy with the close of first 5 mins candle @ 2855 with the low as SL 2845. The whole day not even once it tried to do anything different other than to go up.
If you read my post on 12 Mar 2009 -
"3. Now if somehow we manage to close above 3000, it will negate the big triangle breakdown giving a totally new spin to this bear market. Then 3250/3700 may not be so difficult."
We are exactly at this point in time. So keep a sharp eye, be flexible and play with the trend.
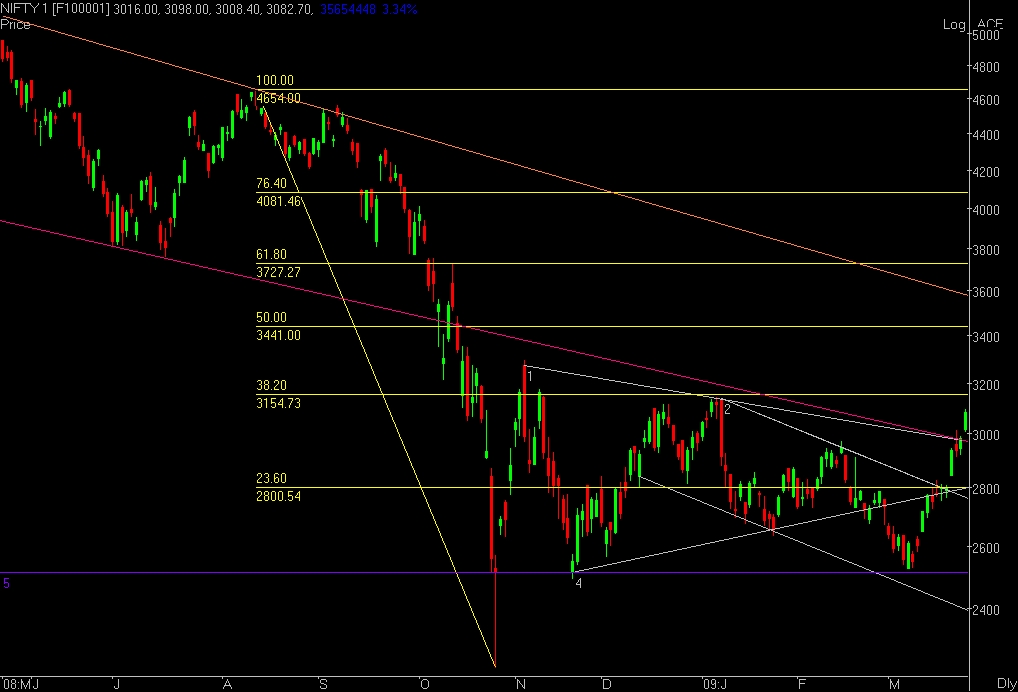
In my "Nifty Weekly Outlook " I had given the MiniNifty chart. But due the difference in the opening value on 05/11/2008 & 07/01/2009 between MiniNifty & Nifty Futures the trendline look different. In this post I have attached the Nifty Futures chart for more clarity.
Links :
http://www.cmegroup.com/education/ts.html. Click under the Trading Tutorials section. Good educative videos.
Happy Trading
Anshuman (Punter)
| Description: |
|
| Filesize: |
132.66 KB |
| Viewed: |
3536 Time(s) |
|
| Description: |
|
| Filesize: |
117.14 KB |
| Viewed: |
3536 Time(s) |
|
|
|
| Back to top |
|
 |
|
|
 |
anshuman
White Belt

Joined: 19 Jan 2009
Posts: 41
|
|
| Back to top |
|
 |
anshuman
White Belt

Joined: 19 Jan 2009
Posts: 41
|
Post: #18  Posted: Wed Mar 25, 2009 8:53 pm Post subject: Posted: Wed Mar 25, 2009 8:53 pm Post subject: |
 |
|
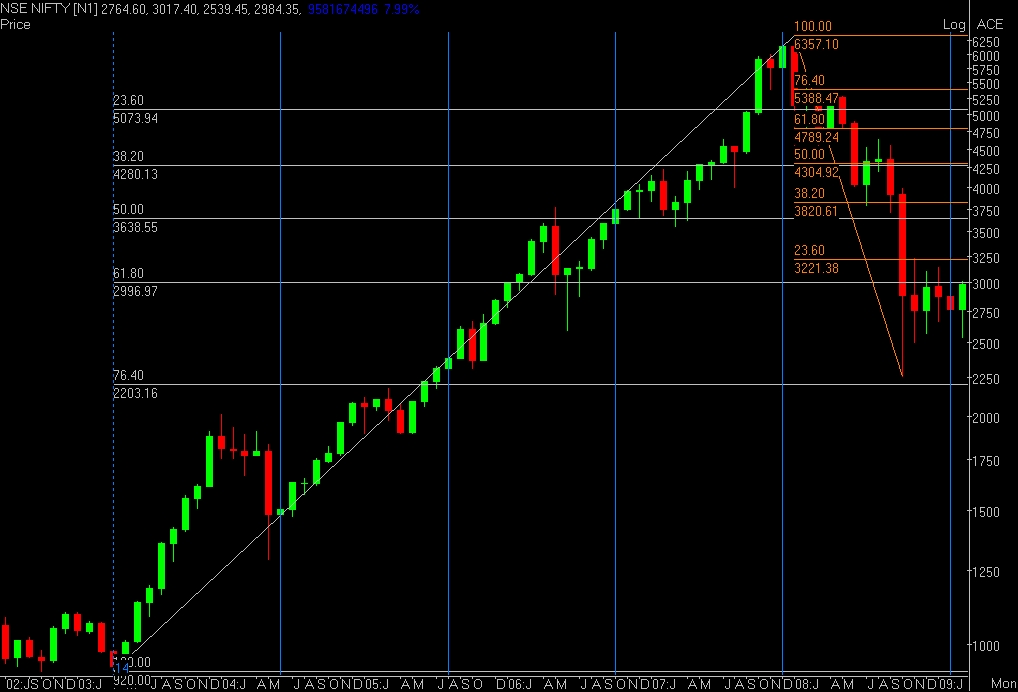
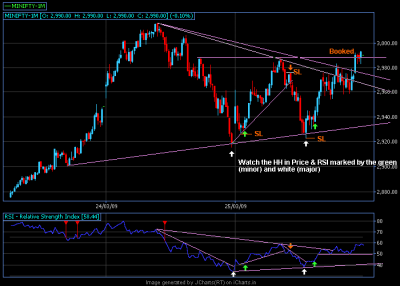
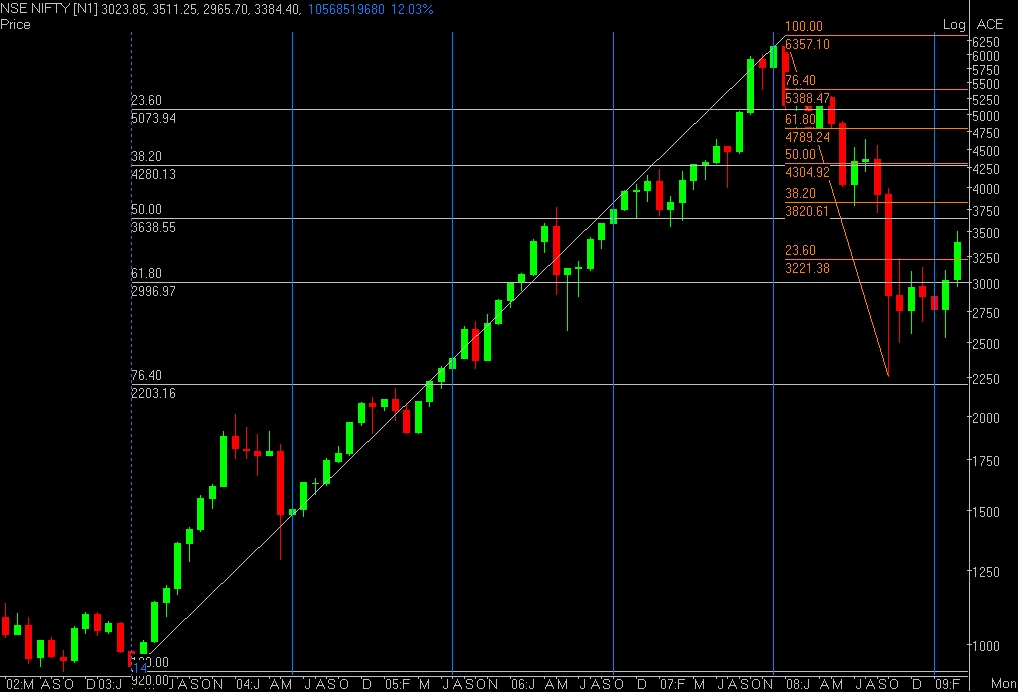
I have attached a 14 period timecycle chart on NS. The Feb 09 month was the one which fall on 14, which means we can see an intermediate trend up. We are already up 7.99% for the month. The 23.6% of the recent fall fron Jan 08 gives a target of 3221. So atleast this much can be expected in the weeks to come.
As far as the this weeks picture goes, as long as 2845 holds this week we can go anywhere on the upside. The range given ystrdy may get breached on the upside.
Happy Trading 
Anshuman (Punter)
| Description: |
|
| Filesize: |
150.08 KB |
| Viewed: |
3504 Time(s) |
|
| Description: |
|
| Filesize: |
12.96 KB |
| Viewed: |
488 Time(s) |
|
|
|
| Back to top |
|
 |
anshuman
White Belt

Joined: 19 Jan 2009
Posts: 41
|
Post: #19  Posted: Thu Mar 26, 2009 11:28 pm Post subject: Posted: Thu Mar 26, 2009 11:28 pm Post subject: |
 |
|
Last edited by anshuman on Thu Mar 26, 2009 11:36 pm; edited 1 time in total |
|
| Back to top |
|
 |
anshuman
White Belt

Joined: 19 Jan 2009
Posts: 41
|
Post: #20  Posted: Thu Mar 26, 2009 11:35 pm Post subject: Posted: Thu Mar 26, 2009 11:35 pm Post subject: |
 |
|
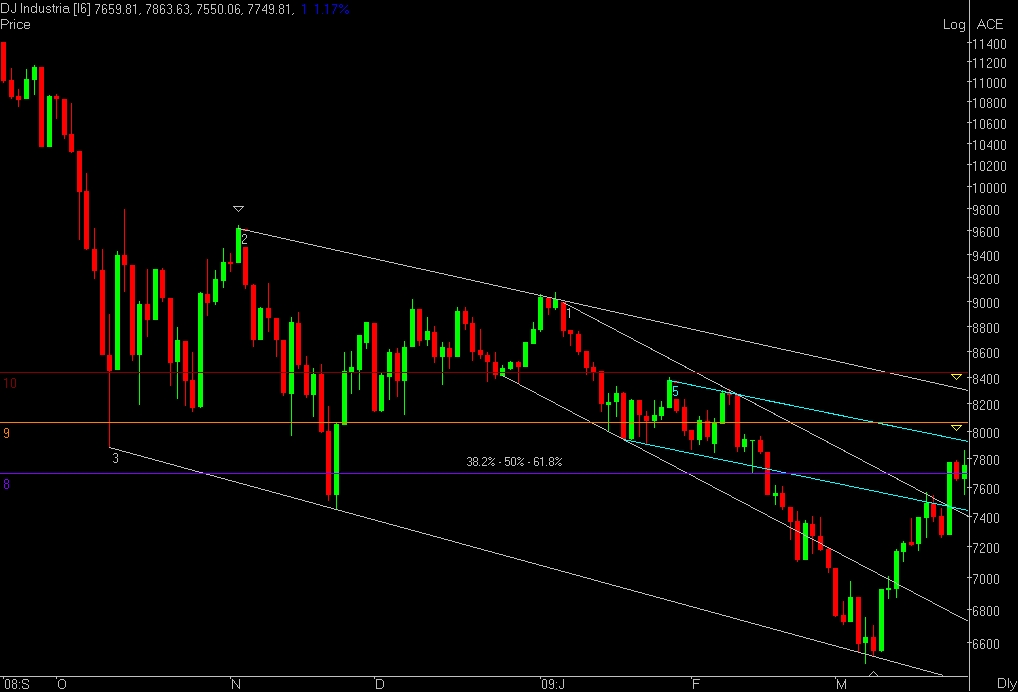
Its Rocking ..................
Keep an eye on FII flows and DOW, as long as they are positive only sky is the limit. We may take some break around 3154 +/-.
Happy trading
Anshuman (Punter)
| Description: |
|
| Filesize: |
11.45 KB |
| Viewed: |
3474 Time(s) |
|
| Description: |
|
| Filesize: |
132.7 KB |
| Viewed: |
3474 Time(s) |
|
| Description: |
|
| Filesize: |
163.28 KB |
| Viewed: |
3533 Time(s) |
|
Last edited by anshuman on Sat Mar 28, 2009 11:46 am; edited 1 time in total |
|
| Back to top |
|
 |
aravindswamy
White Belt

Joined: 31 Jul 2008
Posts: 20
|
Post: #21  Posted: Fri Mar 27, 2009 5:45 am Post subject: Posted: Fri Mar 27, 2009 5:45 am Post subject: |
 |
|
Dear anshu
Fantastic chart analysis for NF , pl post without fail , congrats for ur improvement in chart studies. pl psot it daily wothout fail. 
|
|
| Back to top |
|
 |
saikat
White Belt

Joined: 31 Mar 2008
Posts: 317
|
Post: #22  Posted: Sun Mar 29, 2009 10:45 am Post subject: Hi Posted: Sun Mar 29, 2009 10:45 am Post subject: Hi |
 |
|
Anshu,
Absolutely wonderful... this thread of yours.
Saw it first time today...
So I have found another buddy who believes that consistent profit can be made just by trendlines and patterns 
I just loved your charts...
Cheers...
Saikat
|
|
| Back to top |
|
 |
anshuman
White Belt

Joined: 19 Jan 2009
Posts: 41
|
Post: #23  Posted: Sun Mar 29, 2009 7:56 pm Post subject: Posted: Sun Mar 29, 2009 7:56 pm Post subject: |
 |
|
Hi Saikat,
Thanks  ........... learned so much here, its just a small ........... learned so much here, its just a small
attempt to try to give back something.
Anshu
|
|
| Back to top |
|
 |
anshuman
White Belt

Joined: 19 Jan 2009
Posts: 41
|
Post: #24  Posted: Sun Mar 29, 2009 8:31 pm Post subject: Nifty Weekly Outlook :- Posted: Sun Mar 29, 2009 8:31 pm Post subject: Nifty Weekly Outlook :- |
 |
|
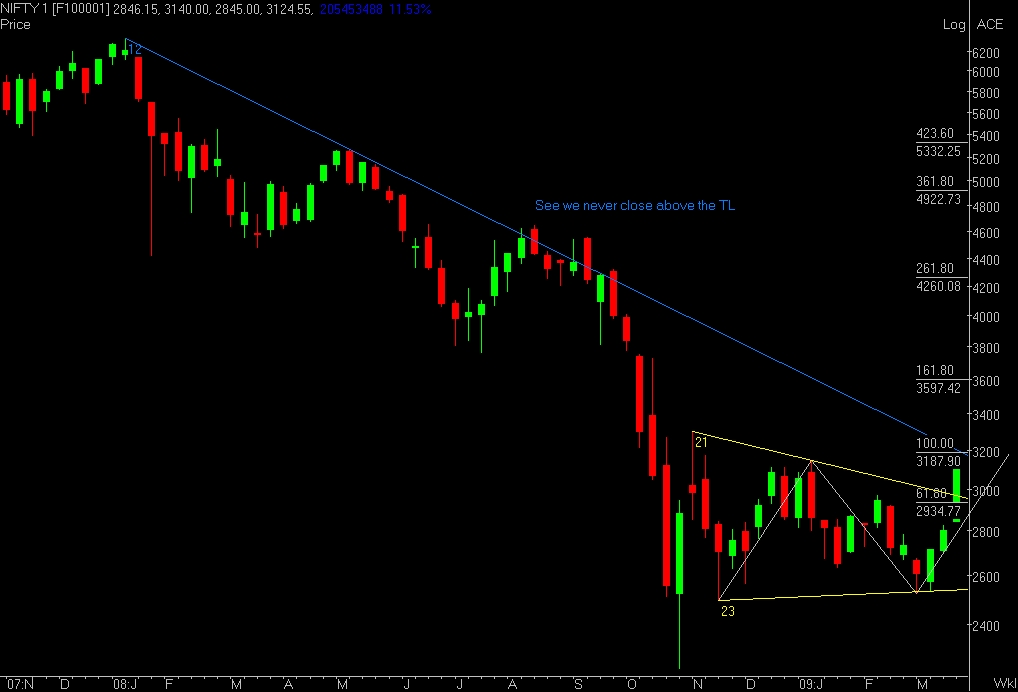
Nifty Weekly Outlook :-
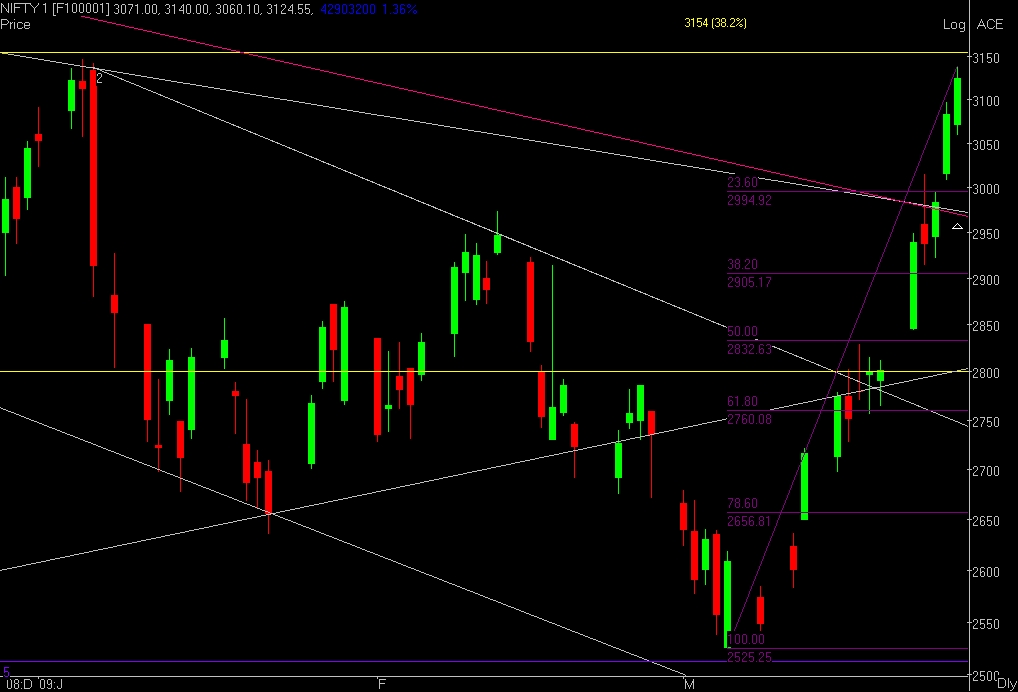
* Upside range is 3188 (Weekly chart) - 3154 (Dialy chart).
The 3154 given on thursday missed out by half percent on friday.
* Downside range is 2935 (Weekly chart) - 2905 (Dialy chart).
2905 is the fibo. 38.2% which will automatically go up as/if we move
to the upper range.
Closely watch the Triangle Breakout in the weekly charts. It has the legs to carry the market to 3783. The best thing will be some amount of consolidation above the white(Dialy) and yellow(Weekly) trendlines which holds the key, and then a rally. Taking into the fibo retracements into consideration we must not close below 2905. That will mean breakout failure, certainly not a good omen after such a fabulous rally.
Happy Trading 
Anshuman (Punter)
| Description: |
|
| Filesize: |
149.08 KB |
| Viewed: |
4344 Time(s) |
|
| Description: |
|
| Filesize: |
116.58 KB |
| Viewed: |
4344 Time(s) |
|
|
|
| Back to top |
|
 |
anshuman
White Belt

Joined: 19 Jan 2009
Posts: 41
|
Post: #25  Posted: Thu Apr 16, 2009 7:26 pm Post subject: Posted: Thu Apr 16, 2009 7:26 pm Post subject: |
 |
|
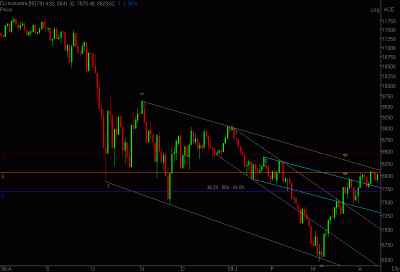
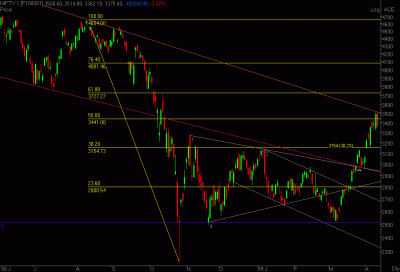
Is it the time for a tea break ???
| Description: |
|
| Filesize: |
17.02 KB |
| Viewed: |
504 Time(s) |
|
| Description: |
|
| Filesize: |
19.95 KB |
| Viewed: |
524 Time(s) |
|
|
|
| Back to top |
|
 |
anshuman
White Belt

Joined: 19 Jan 2009
Posts: 41
|
Post: #26  Posted: Sun Apr 19, 2009 11:48 pm Post subject: Posted: Sun Apr 19, 2009 11:48 pm Post subject: |
 |
|
| Description: |
|
| Filesize: |
172.05 KB |
| Viewed: |
3309 Time(s) |
|
| Description: |
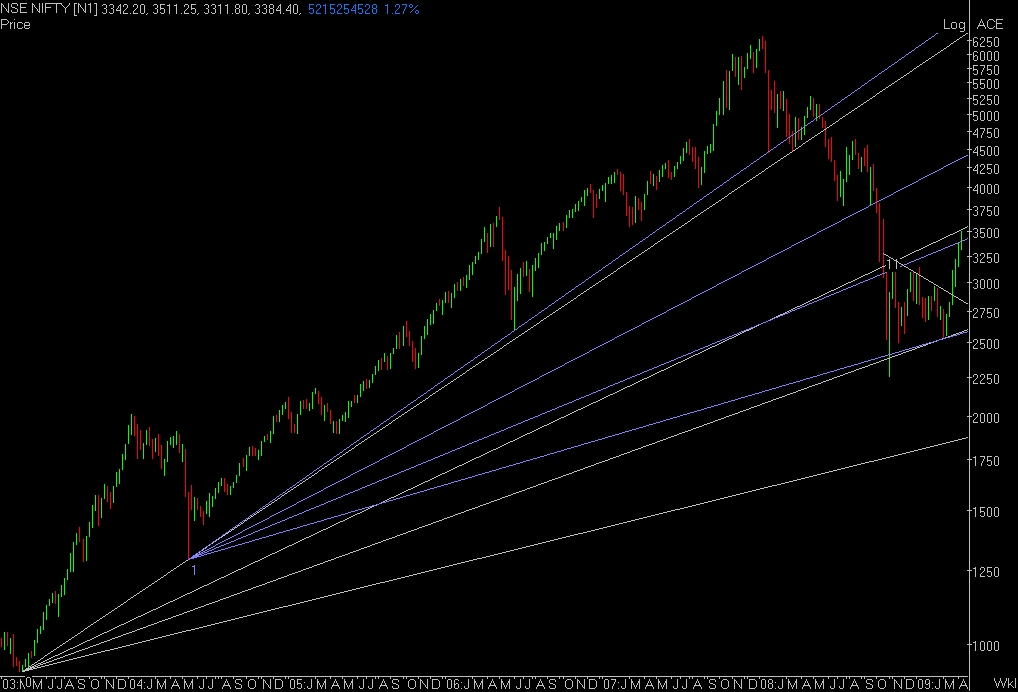
| March has indeed proved to be the reversal month as given earlier |
|
| Filesize: |
151.03 KB |
| Viewed: |
3309 Time(s) |
|
|
|
| Back to top |
|
 |
anshuman
White Belt

Joined: 19 Jan 2009
Posts: 41
|
|
| Back to top |
|
 |
anshuman
White Belt

Joined: 19 Jan 2009
Posts: 41
|
Post: #28  Posted: Tue Apr 21, 2009 5:19 pm Post subject: Posted: Tue Apr 21, 2009 5:19 pm Post subject: |
 |
|
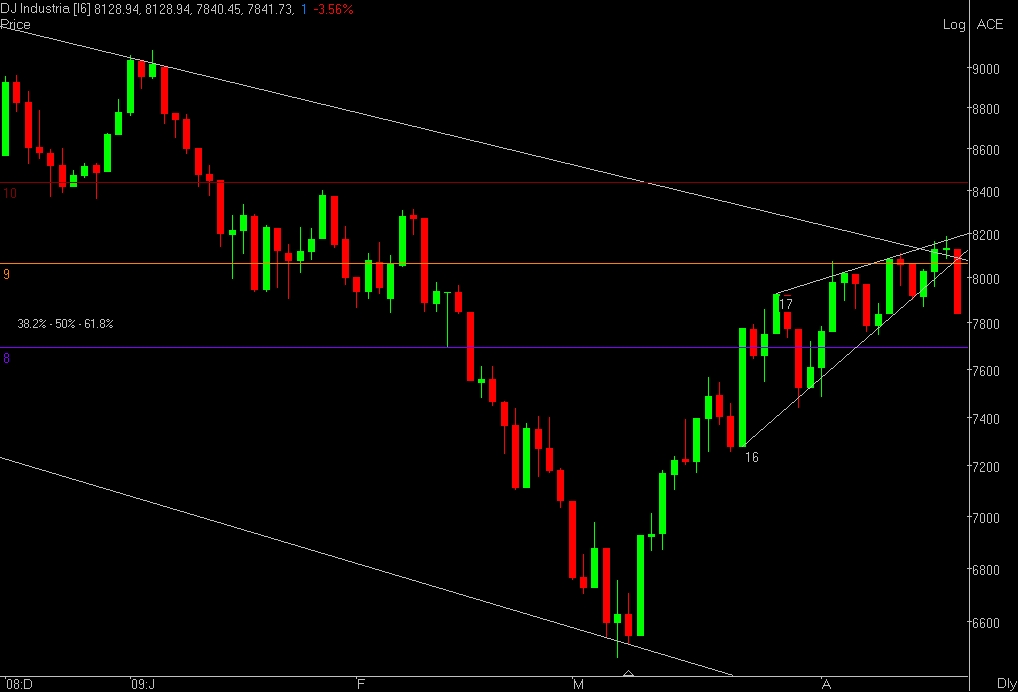
Dow ka band kyun baja ????
| Description: |
|
| Filesize: |
106.65 KB |
| Viewed: |
3240 Time(s) |
|
|
|
| Back to top |
|
 |
anshuman
White Belt

Joined: 19 Jan 2009
Posts: 41
|
|
| Back to top |
|
 |
anshuman
White Belt

Joined: 19 Jan 2009
Posts: 41
|
Post: #30  Posted: Mon Apr 27, 2009 4:03 pm Post subject: Posted: Mon Apr 27, 2009 4:03 pm Post subject: |
 |
|
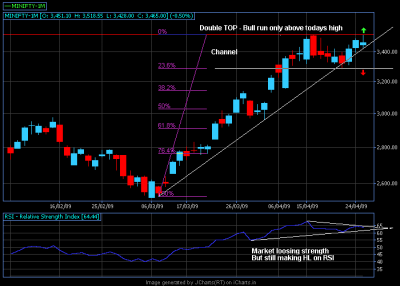
Todays Update :-
| Description: |
|
| Filesize: |
12.62 KB |
| Viewed: |
513 Time(s) |
|
|
|
| Back to top |
|
 |
|

