| View previous topic :: View next topic |
| Author |
Nifty Trade Log for Today |
anshuman
White Belt

Joined: 19 Jan 2009
Posts: 41
|
Post: #1  Posted: Thu Mar 12, 2009 4:30 pm Post subject: Nifty Trade Log for Today Posted: Thu Mar 12, 2009 4:30 pm Post subject: Nifty Trade Log for Today |
 |
|
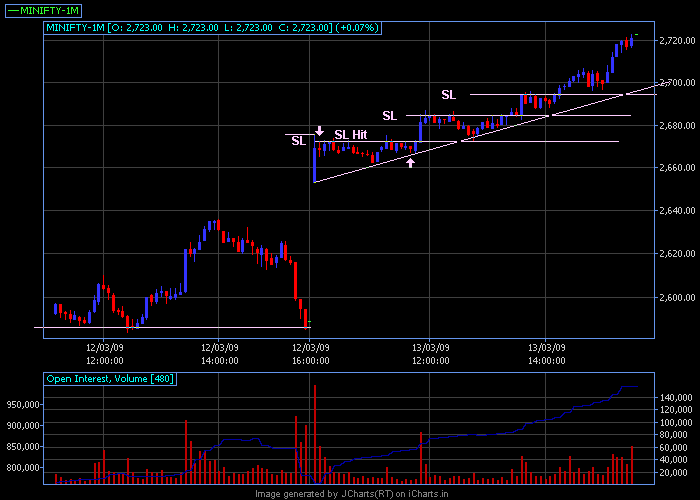
TRADES:
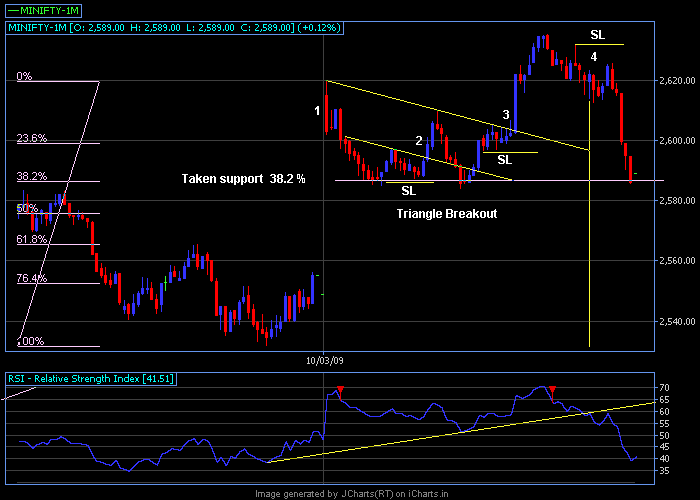
1. Buy 2607 SL 2602 (First 5 mins candle trade) Result = Loss 5 points.
2. Triangle Breakout Buy 2597 SL 2585.5, as soon as price moves up move SL to CP. Result = NPNL
3. Triangle Breakout Buy 2600 SL 2595, move SL to CP. Booked @ 2620 Result = Profit 20 points.
4. Trendline break on both RSI + Price (Not shown on the charts). Short @ 2620 SL 2632. Result = Profit 30 points. See the OI analysis on 30 mins chart for more details.
20 Mins Chart :
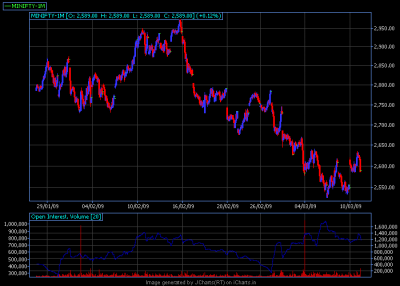
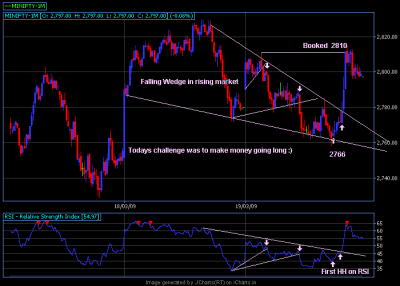
Today is the first day after a really long-long time that we have an addition of OI with rise in price. TODAYS PRICE ACTION IN THE FIRST PART OF THE DAY IS NOT BCOZ OF SHORT COVERING, ITS FRESH BUYING. The catch is to trap all these bulls intraday. Being the first day all are on the edge and by the end of the day are forced to square off almost all their positions.
| Description: |
|
| Filesize: |
10.79 KB |
| Viewed: |
9541 Time(s) |
|
| Description: |
|
| Filesize: |
14.28 KB |
| Viewed: |
684 Time(s) |
|
|
|
| Back to top |
|
 |
|
|
 |
anshuman
White Belt

Joined: 19 Jan 2009
Posts: 41
|
Post: #2  Posted: Thu Mar 12, 2009 9:50 pm Post subject: What can make the market bullish ? Posted: Thu Mar 12, 2009 9:50 pm Post subject: What can make the market bullish ? |
 |
|
What can make the market bullish ?
Situation:
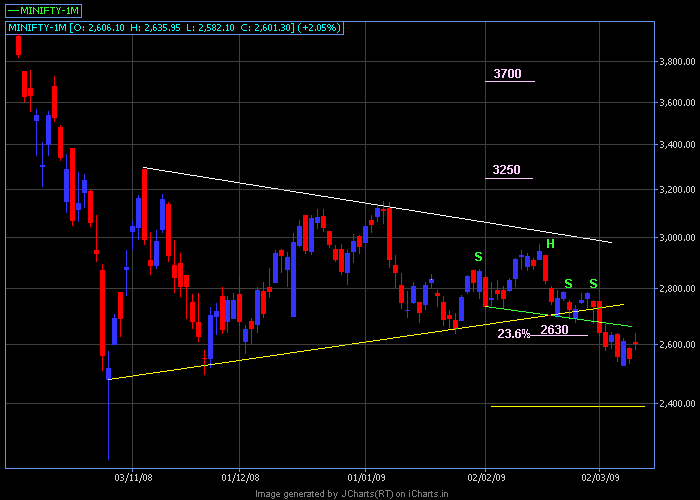
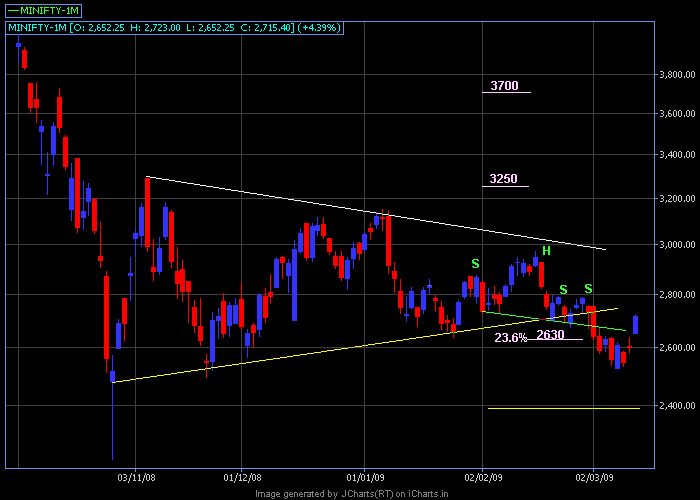
From Jan 08 we are falling then went into a consolidation phase from Nov 08 to Feb 09. Last time also we had a H&S in Sep 08 in dialy charts the same this time with a price target of 2390 +/-.
Possibility:
I am a great believer in trendlines and patterns. So the analysis goes like this..........
1. The market can always test the neckline (GREEN) and again go down to 2390. So try to spot reversal signs above 2662 (Neckline level for today close) intraday and play for positional shorts.
2. If market doesn't fall and start consolidating above 2630, then I will consider the H&S failure. This failure should take Nifty Futures to 2850 level. I will wait for someother trendline break or pattern for downside.
3. Now if somehow we manage to close above 3000, it will negate the big triangle breakdown giving a totally new spin to this bear market. Then 3250/3700 may not be so difficult.
| Description: |
|
| Filesize: |
9.5 KB |
| Viewed: |
9490 Time(s) |
|
|
|
| Back to top |
|
 |
anshuman
White Belt

Joined: 19 Jan 2009
Posts: 41
|
Post: #3  Posted: Sun Mar 15, 2009 6:25 pm Post subject: Nifty Trade Log for Today Posted: Sun Mar 15, 2009 6:25 pm Post subject: Nifty Trade Log for Today |
 |
|
Watch the addition of OI in the 5 mins trade setup.
If you have missed the bus, don't run after it. Wait for the next bus to come. Keep an watch on the 30-60 mins charts. Good thing about being a trader is play both sides.
| Description: |
|
| Filesize: |
9.5 KB |
| Viewed: |
9386 Time(s) |
|
| Description: |
|
| Filesize: |
10.58 KB |
| Viewed: |
9386 Time(s) |
|
|
|
| Back to top |
|
 |
anshuman
White Belt

Joined: 19 Jan 2009
Posts: 41
|
|
| Back to top |
|
 |
sandew
White Belt

Joined: 02 Feb 2009
Posts: 174
|
Post: #5  Posted: Mon Mar 16, 2009 11:16 pm Post subject: Posted: Mon Mar 16, 2009 11:16 pm Post subject: |
 |
|
Anshuman, educative charts - thank you for sharing. Question - with rsi being where it is would you not cover long earlier and refrain from entering fresh long in course of Mar 16th - what other oscillators you would refer for confirmation inthis scenario of mar 16th.
and yes pls do updating each day - we like your charts
|
|
| Back to top |
|
 |
anshuman
White Belt

Joined: 19 Jan 2009
Posts: 41
|
Post: #6  Posted: Tue Mar 17, 2009 12:24 am Post subject: Posted: Tue Mar 17, 2009 12:24 am Post subject: |
 |
|
Hi Sandew,
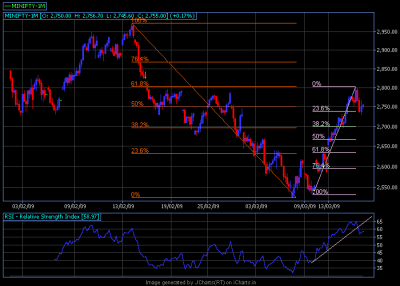
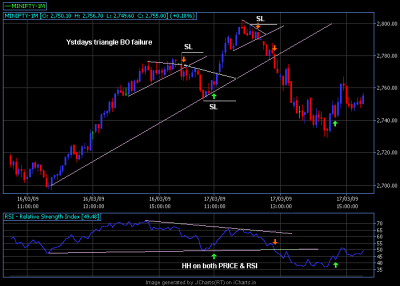
First Question: The condition on 13 March 2009 is known as "Mega overbought condition". The bulls are so strong that the RSI remained above 60 the whole day. If you go back to NOV 2008 as far as I remember there is just one day. So the question of short doesn't exist. So I carried over my positional longs. Read more in Martin Pring on Market Momentum, chapter 1 - Overbought & Oversold.
Second Question: I use only patterns, trendlines and RSI. Nothing else. I draw them in every timeframe. I have seen almost all moves are a result of some pattern formation or break in trendline. If it was none of the above then its divergence in RSI. For me it completes the picture. The big advantage of this is trending OR rangebound it doesn't matter bcoz you are not following something which is "dynamic" with the price. SlowD on 10 mins is good but today it even failed.
Today also the target for H&S was 2673. It failed so now the market will go up - LONG. Pick the spot where the SL is not more than 5-10 points. Sit quite you will see a trendline break OR pattern when you will book profit. Watch the triangle at the end, even that had a breakout. At last I booked my intraday @ 3.29 PM.
You may find this link usefull -
http://picasaweb.google.com/traderstratagem/Traderstratagem?authkey=Gv1sRgCMOyxr-XlOn1hwE&feat=directlink#
Happy Trading !!
Anshuman
|
|
| Back to top |
|
 |
anshuman
White Belt

Joined: 19 Jan 2009
Posts: 41
|
Post: #7  Posted: Tue Mar 17, 2009 3:34 pm Post subject: Nifty Trade Log for Today Posted: Tue Mar 17, 2009 3:34 pm Post subject: Nifty Trade Log for Today |
 |
|
| Description: |
|
| Filesize: |
15.11 KB |
| Viewed: |
670 Time(s) |
|
| Description: |
|
| Filesize: |
12.94 KB |
| Viewed: |
648 Time(s) |
|
|
|
| Back to top |
|
 |
GAJRAJ
White Belt

Joined: 02 Sep 2007
Posts: 17
|
Post: #8  Posted: Tue Mar 17, 2009 9:22 pm Post subject: Posted: Tue Mar 17, 2009 9:22 pm Post subject: |
 |
|
Neat & Nice interpretation of chart please keep it up & post daily. 
|
|
| Back to top |
|
 |
aravindswamy
White Belt

Joined: 31 Jul 2008
Posts: 20
|
Post: #9  Posted: Tue Mar 17, 2009 11:31 pm Post subject: Posted: Tue Mar 17, 2009 11:31 pm Post subject: |
 |
|
[quote="GAJRAJ"]Neat & Nice interpretation of chart please keep it up & post daily.  [/quote] [/quote]
|
|
| Back to top |
|
 |
anshuman
White Belt

Joined: 19 Jan 2009
Posts: 41
|
Post: #10  Posted: Wed Mar 18, 2009 4:01 pm Post subject: Nifty Trade Log for Today Posted: Wed Mar 18, 2009 4:01 pm Post subject: Nifty Trade Log for Today |
 |
|
| Description: |
|
| Filesize: |
11.94 KB |
| Viewed: |
702 Time(s) |
|
|
|
| Back to top |
|
 |
anshuman
White Belt

Joined: 19 Jan 2009
Posts: 41
|
Post: #11  Posted: Thu Mar 19, 2009 5:21 pm Post subject: Nifty Trade Log for Today Posted: Thu Mar 19, 2009 5:21 pm Post subject: Nifty Trade Log for Today |
 |
|
| Description: |
|
| Filesize: |
10.29 KB |
| Viewed: |
3968 Time(s) |
|
| Description: |
|
| Filesize: |
13.41 KB |
| Viewed: |
599 Time(s) |
|
|
|
| Back to top |
|
 |
anshuman
White Belt

Joined: 19 Jan 2009
Posts: 41
|
Post: #12  Posted: Sat Mar 21, 2009 1:02 am Post subject: Nifty Weekly Outlook Posted: Sat Mar 21, 2009 1:02 am Post subject: Nifty Weekly Outlook |
 |
|
Nifty Weekly Outlook :-
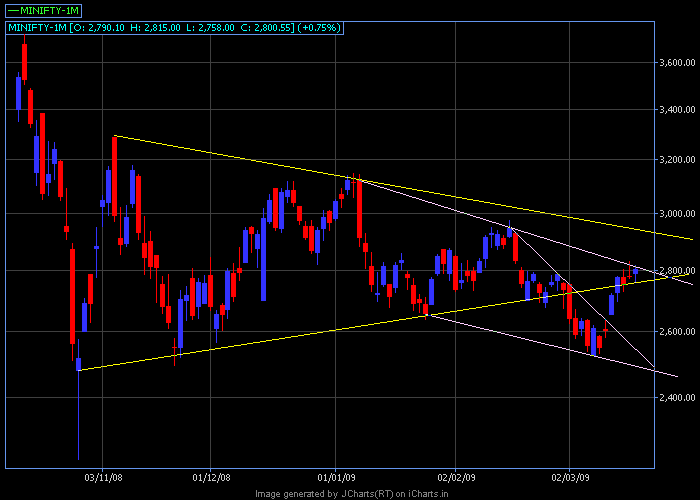
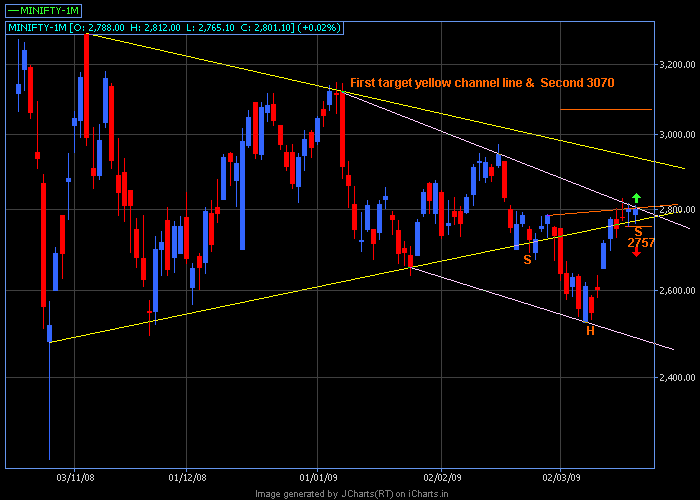
We have an inverted H&S pattern on the charts which will confirm ONLY WITH A CLOSSING ABOVE FRIDAY'S HIGH. As long as the market remains above the yellow channel line OR 2757 (horizontal line above the S) the current uptrend will continue. We can look for a target of the yellow channel line and finally 3070.
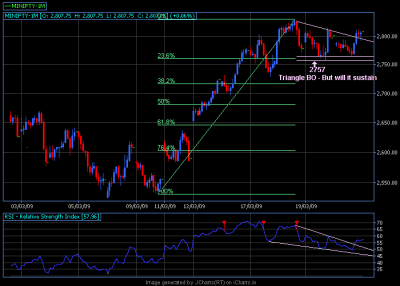
Below 2757 CLOSING which is also the 23.6% retracement of the recent uptrend from 2525, the downtrend will again start. We are at the top of the falling channel (White). Pls. remember for any uptrend we have to breakout from the falling channel mentioned above. If we can't then it can only go down for the time being.
One thing to be noted for the H&S is its not necessary that if it breaks 2757 then its invalid. Pls. see the 30 mins chart. It can reverse from any of the plotted fibo. levels. The challenge is to do your trades with the big picture in mind.
Happy Trading 
Anshuman (Punter)
| Description: |
|
| Filesize: |
10.94 KB |
| Viewed: |
3956 Time(s) |
|
| Description: |
|
| Filesize: |
13.69 KB |
| Viewed: |
576 Time(s) |
|
Last edited by anshuman on Sun Mar 22, 2009 8:58 pm; edited 1 time in total |
|
| Back to top |
|
 |
aravindswamy
White Belt

Joined: 31 Jul 2008
Posts: 20
|
Post: #13  Posted: Sat Mar 21, 2009 6:47 am Post subject: Nifty strategies Posted: Sat Mar 21, 2009 6:47 am Post subject: Nifty strategies |
 |
|
Dear anshuman
Wow what a fine interpretation , thanq for weekly chart, the trend lines in yellow and white indicate correct position.Pl post it daily to educate
[color=blue]us, once again Hats off to you. A swamy[/color]
|
|
| Back to top |
|
 |
swaroopbn
White Belt

Joined: 12 Feb 2008
Posts: 39
|
Post: #14  Posted: Sat Mar 21, 2009 3:56 pm Post subject: Keep it up :) Posted: Sat Mar 21, 2009 3:56 pm Post subject: Keep it up :) |
 |
|
Gr8 job mere bhai.... keep up the good work.
To be precise there is a nice inverted HnS formation on EoD Chart ... I think still the right shoulder work in progress and a retracement till 2835 (38.2%) of current upmove is pending. Then we may fly much higher if we can cross recent high 2830 and close above that 
it will be a showtime next week... 
|
|
| Back to top |
|
 |
anshuman
White Belt

Joined: 19 Jan 2009
Posts: 41
|
Post: #15  Posted: Sun Mar 22, 2009 9:09 pm Post subject: Posted: Sun Mar 22, 2009 9:09 pm Post subject: |
 |
|
Thanks Brother,
I am a little greedy this time and want the nifty to expire as high as possible. My Nifty calls are making me greedy 
Punter
Note: The pattern in the "Nifty Weekly Outlook " is inverted H&S as pointed out by Swaroop. The typo was corrected.
|
|
| Back to top |
|
 |
|

