|
|
| View previous topic :: View next topic |
| Author |
Nifty View - By Welgro |
welgro
Brown Belt

Joined: 24 Sep 2012
Posts: 1784
|
|
| Back to top |
|
 |
|
| |
apka
Black Belt

Joined: 13 Dec 2011
Posts: 6137
|
Post: #47  Posted: Fri Jul 26, 2013 1:09 pm Post subject: Re: Banknifty target 3399 ??? Are you ready ??? Posted: Fri Jul 26, 2013 1:09 pm Post subject: Re: Banknifty target 3399 ??? Are you ready ??? |
 |
|
I have not come across that thread before.... what is the setup? |
|
| Back to top |
|
|
welgro
Brown Belt
Joined: 24 Sep 2012
Posts: 1784
|
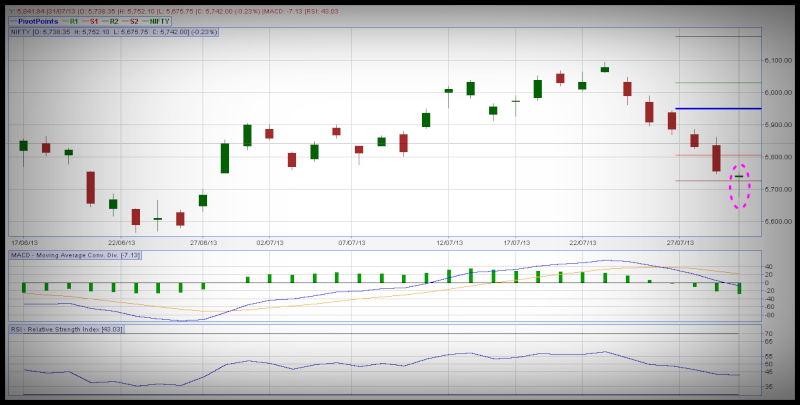
| Post: #48 Posted: Sat Jul 27, 2013 10:02 am Post subject: NIFTY FUTURE ANALYSIS 29/JUL/2013 |
|
|
Rounded Top Chart Pattern ???
Jul 30, 2013
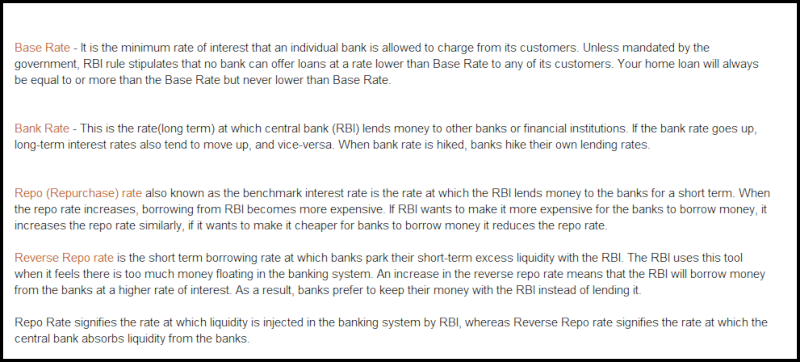
RBI First Quarter Review of Monetary Policy 2013-14
 |
|
| Back to top |
|
|
riteshucha
Green Belt

Joined: 19 May 2012
Posts: 1292
|
| Post: #49 Posted: Sat Jul 27, 2013 3:26 pm Post subject: |
|
|
welgro u r indeed doing a tremendous job in analysing as well as educating... keep it up  |
|
| Back to top |
|
|
welgro
Brown Belt
Joined: 24 Sep 2012
Posts: 1784
|
| Post: #50 Posted: Mon Jul 29, 2013 9:34 am Post subject: NIFTY SPOT H&S |
|
|
| NIFTY SPOT H&S PATTERN ??? |
|
| Back to top |
|
|
welgro
Brown Belt
Joined: 24 Sep 2012
Posts: 1784
|
| Post: #51 Posted: Tue Jul 30, 2013 7:19 am Post subject: BANKNIFTY UPDATES 30.07.2013 |
|
|
| Banknifty updates 30.07.2013 |
|
| Back to top |
|
|
welgro
Brown Belt
Joined: 24 Sep 2012
Posts: 1784
|
| Post: #52 Posted: Tue Jul 30, 2013 8:55 am Post subject: NIFTY FUTURE ANALYSIS 30/JUL/2013 |
|
|
Today nifty future facing strong resistance at
our trading resistance level,once if trade and hold
above this level then exit your all positional nifty shorts.....
Opportunities will come and go. Are you prepared to grab them?
~ Rakesh Jhunjhunwala |
|
| Back to top |
|
|
veerappan
Expert

Joined: 19 Dec 2007
Posts: 3680
|
| Post: #53 Posted: Tue Jul 30, 2013 12:45 pm Post subject: |
|
|
keep rocking santh... welgro.. vaetti katnavan oorula kovanam katna namma ellam paithiyamnu sollura ooru...adha pathi namakkeenna..  |
|
| Back to top |
|
|
pkholla
Black Belt
Joined: 04 Nov 2010
Posts: 2890
|
| Post: #54 Posted: Tue Jul 30, 2013 1:17 pm Post subject: |
|
|
| veeru: please show some courtesy by giving English/ Hindi translation also for 90% users who dont know your language so we can also enjoy your humorous joke. Prakash Holla |
|
| Back to top |
|
|
veerappan
Expert
Joined: 19 Dec 2007
Posts: 3680
|
| Post: #55 Posted: Tue Jul 30, 2013 1:39 pm Post subject: |
|
|
| pkholla wrote: | | veeru: please show some courtesy by giving English/ Hindi translation also for 90% users who dont know your language so we can also enjoy your humorous joke. Prakash Holla |
prakash sorry to say bloody english i hate that in my school days..now its giving trouble... hindi slowly picking up from sb [shout box].. thanks to icharts team ... hindi friends... better shall i tell u one thing.. one who knows tamil hindi english fluently u shd ask them and enjoy that proverb... again i have to ask very sorry... if i translate that english will change the meaning of these things... so i dont want.. to do that...  |
|
| Back to top |
|
|
welgro
Brown Belt
Joined: 24 Sep 2012
Posts: 1784
|
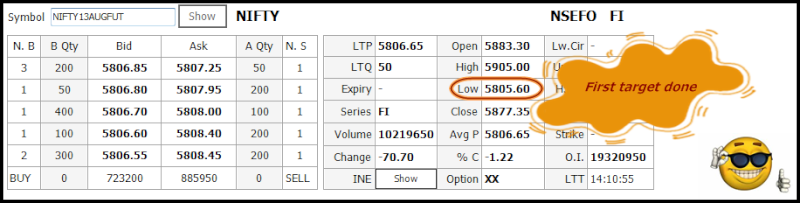
| Post: #56 Posted: Tue Jul 30, 2013 2:15 pm Post subject: first target done |
|
|
 |
|
| Back to top |
|
|
pkholla
Black Belt
Joined: 04 Nov 2010
Posts: 2890
|
| Post: #57 Posted: Tue Jul 30, 2013 2:34 pm Post subject: |
|
|
| Veeru: Thanks for your honest reply. I will do as you ask and request someone to translate to English. Dhanyavadam. Prakash Holla |
|
| Back to top |
|
|
welgro
Brown Belt
Joined: 24 Sep 2012
Posts: 1784
|
| Post: #58 Posted: Wed Jul 31, 2013 8:18 am Post subject: NIFTY FUTURE ANALYSIS 31/JUL/2013 [VIMALRAJ] |
|
|
Without technical charts, you cannot perform foreign exchange technical analysis. Technical charts are the essence of the purely objective way of predicting market trends. You study these charts to find patterns that could predict the rise and fall of a index value. But how do you use technical charts? Here are 5 steps you must use to do so effectively:
Step one: Choose the right type of chart.
Unless you are studying someone else’s chart, you have to create your own. When you do that, you are able to really study the raw data. You know where the data are from and whether they are accurate or not. You have to choose a chart that will best satisfy what you are looking for. You can use a computer to create your chart. There is even a choice of different charts. All you need to do is use a foreign exchange technical analysis software.
Step two: Plot the points.
Once you have chosen the chart, you can now plot the points. As with picking the type of chart, you can also use the software to plot the points presented in the chart. Make sure that you are closely following the raw data that you have collected.
Step three: Find the trends.
Once all the points have been plotted, it is time for you to look at peaks and valleys in the charts. These ups and downs will be forming patterns over time. Look for trends that form from recurring ups and downs. But do not just look at these points–it is best that you mark those points for later analysis. Use vertical or diagonal lines to mark important trends that you have found. You may also draw trends line, which are lines drawn through the major low points.
Step four: Find points of support and resistance.
So what do these support and resistance mean in the world of positional trading? Well, support refers to a barrier that prevents a value from falling. In contrast, resistance refers to a barrier that prevents a value from rising. You must then mark down points of support and resistance, since a lot of buying and selling at a certain value is what is causing the support or resistance. Mark the barriers with horizontal lines.
Step five: Finalize the market predictions.
Now, it is time for you to look back at the chart that you have created and plotted. Take note of all the patterns and the points of support and resistance. Based on those patterns and points, you may already finalize your market predictions. Once you have predicted what could happen on the next trading day, week or month, depending on the period that you have been studying, you can already decide on your move. Of course, you should also come back to study your charts again after you have your results based on your next trading move.
Technical charts eliminate the need for guess work, but work on the assumption that trading history repeats itself. They also do not follow the idea that currency values can be affected by other factors, such as sudden death of a leader, breakout of war, or unprecedented financial crisis.
Want to Learn More Median line study ?
http://www.mediafire.com/view/yjfsdmffpnf0noc/ml_research_ebook.pdf |
|
| Back to top |
|
|
bharatpatel
White Belt

Joined: 26 Oct 2011
Posts: 401
|
| Post: #59 Posted: Wed Jul 31, 2013 8:52 am Post subject: |
|
|
keep educating us just like this.
keep it continue. |
|
| Back to top |
|
|
welgro
Brown Belt
Joined: 24 Sep 2012
Posts: 1784
|
| Post: #60 Posted: Thu Aug 01, 2013 8:52 am Post subject: NIFTY FUTURE ANALYSIS 01/AUG/2013 [VIMALRAJ] |
|
|
Pin Bars Pattern
A pin bar is actually a candlestick pattern where the main body of the candle is very small with a long wick. The wick of the pin bar is two to three times the size of its body. Pin bar formations assist traders to find reversal setups for exhaustive trends and fading corrective moves for trend continuation setups.
Pin bars are also referred to as hammers/ hanging man and shooting stars. There are two types of pin bars namely: the bearish pin bar and the bullish pin bar. The bearish pin bar occurs after an uptrend and has a head with the real body and a long upper shadow.
Figure 1: Showing a bullish pin bar and a bearish pin bar
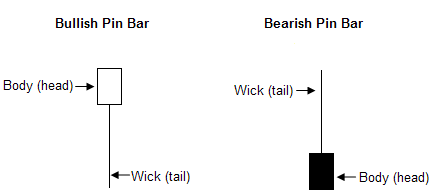
The color of the head can either be red or green and/or white or black depending on your bar chart. Bullish pin bars that have a bull close will be much stronger reversal signals than those with a bear close. Vice versa for a bearish reversal pin bar.
Figure 2: Showing a bullish pin bar in an uptrend and a bearish one in a downtrend
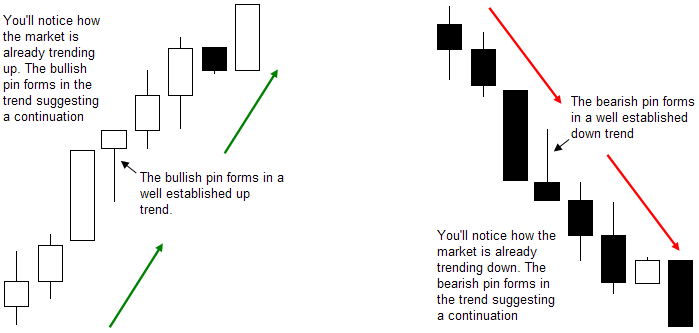
The bullish reversal pin bars are great indicators of the incoming profitability of the market while the bearish reversal pin bars signify the losses of the market. Acquaintance with pin bars will enable a price action trader to identify potential reversals and/or signifying a continuation depending upon the type and location.
Pin bars also occur at correction levels and main market turning points; including the falling trends, rising trends and range bound environments. Pin bars are most accurate trading indicators when they are joined with high support or resistance levels, main trend ratification, and clear formation.
Traders can make entries, exits and place stop-losses in the market simply by following the pin bars and how they form. They can enter a bullish or bearish pin bar as it breaks either the high or low of the real body depending on the direction of trading.
An effective pin bar trading strategy is vital to price action trading for identifying high probability setups. The pin bar can be traded on any time frame and from appropriate price action support and resistance levels.
How to Profit with Pin Bars
What are pin bars? Pin bars are single-candlestick reversal patterns. In other words, they are candlestick patterns which are made up of one single candle, often appearing at the top of a trend or at the bottom of a trend.
Pin bars are formed when there is a foregoing trend, and the pin bar candle opens and moves in the direction of the previous trend, only for traders in contrary positions to enter the market and drive the price of the asset in the opposite direction. The result is a candle that looks like a lollipop, with a long shadow, a short body oriented towards one end of the candle, and a short shadow on the other side of the body. The pin bar candlesticks are also known forex as:
a) Hammer
b) Hanging man
c) Inverted hammer
d) Shooting star
The hammer and inverted hammer are bullish reversal pin bars, while the shooting star and hanging man are bearish reversal pin bars.
Pin bars are very important price action patterns because their appearance is a signal that the sentiment in the market has changed, and that it may be time to unwind previous positions and take up new ones in the opposite direction (read this article for more on this).
The signals given by pin bars are not always accurate if you don’t really understand them in the context of the prior price action. For this reason, traders must use a means of confirmation or signal filtering to increase the accuracy of the pin bar signal. But when combined with the right information and price action, they can be powerful signals and great way to enter the market.
Trading with Pin Bars
The process of trading with pin bars is simple.
a) Identify the current trend.
b) Identify the pin bar.
c) Combine the pin bar with a method of trade confirmation (i.e. at key support and resistance areas, at event areas, pullbacks to the 20ema, etc)
d) Execute the trade either at the open or on a 50% retracement of the pin bar
It is not usually hard to identify the current trend. Simply looking at the chart and the direction of the price movement will indicate what the trend has been. You can also look for impulsive and corrective price action.
Identifying the pin bar is the next step. A true pin bar can be recognized by the following characteristics:
a) It has a short body
b) It must have a long shadow on the end that is opposite the direction of the trend, in the direction of the reversal
c) The pin bar should ideally have a closing price that is lower than the open price for a bearish reversal pin bar, and close above the candle open if the pi nbar is a bullish reversal pin bar.
Only pin bars located at either end of the trend should be used. Pin bars occurring at areas of market consolidation or in the middle of a trend will not produce good trading opportunities.
Once the pin bar occurrs at the top or bottom of a trend, and has been identified, it is time to combine the pin bar with a method of trade confirmation. One of the best methods of trade confirmation is by checking to see if the pin bar is at a strong region of support or resistance where price action has had a strong reaction in the past. You can call these event areas, or areas of impulsive price action.
On intraday price action trading, using pivot points for the day works pretty consistently. All a trader needs to do is to download an automatic pivot point tool, apply it to the chart, and the key levels of support and resistance will be displayed.
Typically, the opportunity is to look for where a bearish pin bar forms on a resistance (R1, R2, R3) or where a bullish pin bar is on a support (S1, S2, S3). These are shown in the charts below:
 |
|
| Back to top |
|
|
|
|
You cannot post new topics in this forum
You cannot reply to topics in this forum
You cannot edit your posts in this forum
You cannot delete your posts in this forum
You cannot vote in polls in this forum
You cannot attach files in this forum
You cannot download files in this forum
|
Powered by phpBB © 2001, 2005 phpBB Group
|
|
|


