| View previous topic :: View next topic |
| Author |
Nifty View - May Series 2014 |
welgro
Brown Belt

Joined: 24 Sep 2012
Posts: 1784
|
Post: #256  Posted: Fri May 23, 2014 4:25 pm Post subject: Posted: Fri May 23, 2014 4:25 pm Post subject: |
 |
|
| trunals wrote: | | What does it mean? |
One Big Up-move Waiting....  |
|
| Back to top |
|
 |
|
|
|
vinay28
Black Belt

Joined: 24 Dec 2010
Posts: 11748
|
| Post: #257 Posted: Fri May 23, 2014 10:09 pm Post subject: |
|
|
Nifty for Monday (26/05/14)
Supports are at about 7349, 7324, 7309, 7294, 7276 and 7208 while resistances are at about 7383, 7454 and 7554. Previous highs to watch for are at about 7415/7564. Three +WWs can give about 7454, 7511 and 7580 (+WWs with higher targets are not mentioned as of now). Three -WWs can give about 7286/7232 (once below 7334) and 7054 (once below 7298) (-WWs with much lower targets are not mentioned as of now).
Nifty rose sharply and closed above 7350, at a new all time high and now looks bullish. About 7397 and 7461 on higher side and 7334 on lower side are crucial levels. Market will be looking for quality of the cabinet on 26/5 and other news coming from the Govt. Being an expiry week, trade carefully. |
|
| Back to top |
|
|
welgro
Brown Belt
Joined: 24 Sep 2012
Posts: 1784
|
| Post: #258 Posted: Mon May 26, 2014 10:56 am Post subject: |
|
|
| welgro wrote: | | trunals wrote: | | What does it mean? |
One Big Up-move Waiting.... |
Nifty spot made high :::: 7500.00 :::::
Last edited by welgro on Mon May 26, 2014 11:48 am; edited 1 time in total |
|
| Back to top |
|
|
welgro
Brown Belt
Joined: 24 Sep 2012
Posts: 1784
|
| Post: #259 Posted: Mon May 26, 2014 11:16 am Post subject: |
|
|
Exact Swing Points -Support And Resistance
Where exactly are the support and resistance points?
Where exactly are the swing points on a chart?
This is a particularly important lesson!
Just about every system or method of trading at least takes note of where the key support and resistance levels are.
I have found a double use for my method of identifying these points - They are also Swing Points!
You may think you know where Support and Resistance is, but do you really?
How do you know where support and resistance really is?
The problem with Support and Resistance (S&R) is that it is not a definite number. It is not an exact point on the chart at which price will, without any hesitation stop.
In fact S&R is actually an area - it is not an exact number as we would all like to think.
The dilemma of course, is that in order to do our calculations we need an exact point. You can't enter $50.10/20 area when using fibonacci or working out your stops and limits. You need an exact number even though S&R is not an exact number.
Try telling your broker that you want a stop loss at somewhere between 50 and 55 and watch him burst a blood vessel.
This is what I want to concentrate on in this lesson. This is a technique I have found to be particularly good at not only identifying strong S&R points but also swing points.
In order to find S&R we must first identify market swing points. There are various ways of doing this but I am going to use the one I have used for years.
Swing Up
For the purpose of swing points we are not interested in the open or close of the bars only the high and low.
Take any bar and think of that bar as the start bar (S). If there are two consecutive higher highs than the bar you marked (S) then that is a swing up e.g. bar (1) has a higher high than bar (S) and bar (2) has a higher high than bar (1). If there are not two higher highs than bar (S) then you move to the next bar and see if there are two consecutive higher highs.
This can be particularly useful if the market is trading sideways and you are trying to determine the breakout point. There may be many peaks and valleys but for me there is only one real point - that is the most recent swing up or swing down.
Look at the next diagram
You can see that although there were a few highs and lows that you could have taken as support or resistance, but it wasn't until bar (M) that a definite swing point had been identified and you could mark bar (K) with an (S).
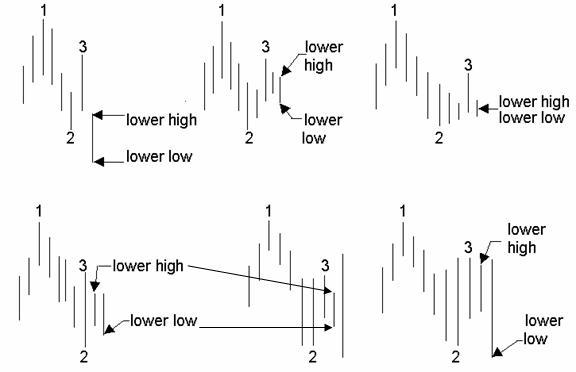
Swing Down
To work out the swing down point - take any bar on a chart and think of that bar as your start point - bar (S). If the next two consecutive bars make lower lows than the previous bar then that is a swing down e.g. bar (1) has a lower low than bar (S) and bar (2) has a lower low then bar (1). If there are not two consecutive lower lows then it is not a swing point and you move to the next bar.
Just as in the example above you can see exactly the same thing with the swing down. Even though price made a few highs and lows it wasn't until bar (M) that you could mark bar (K) as the (S) point.
Support And Resistance
Only once we have clearly marker swing points can we go on to identify our support and resistance points.
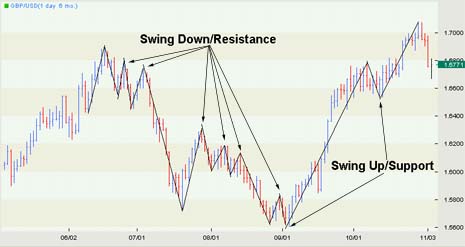
As you can see from the chart I have marked all the swing up points and swing down points. When we are in a down trend then the swing down points act as resistance and when we are in an up trend the swing up points
act as support.
Marking the support and resistance points using this method of first identifying the swing points will give you definite points on a chart from which to calculate your stops, limits and projections.
Copy paste |
|
| Back to top |
|
|
vinay28
Black Belt
Joined: 24 Dec 2010
Posts: 11748
|
| Post: #260 Posted: Mon May 26, 2014 3:06 pm Post subject: |
|
|
| vinay28 wrote: | Nifty for Monday (26/05/14)
Supports are at about 7349, 7324, 7309, 7294, 7276 and 7208 while resistances are at about 7383, 7454 and 7554. Previous highs to watch for are at about 7415/7564. Three +WWs can give about 7454, 7511 and 7580 (+WWs with higher targets are not mentioned as of now). [b]Three -WWs can give about 7286[/b]/7232 (once below 7334) and 7054 (once below 7298) (-WWs with much lower targets are not mentioned as of now).
Nifty rose sharply and closed above 7350, at a new all time high and now looks bullish. About 7397 and 7461 on higher side and 7334 on lower side are crucial levels. Market will be looking for quality of the cabinet on 26/5 and other news coming from the Govt. Being an expiry week, trade carefully. |
targets of first +ww met, second +ww just missed and first -ww also met. |
|
| Back to top |
|
|
amitagg
Black Belt
Joined: 01 Oct 2013
Posts: 4559
|
| Post: #261 Posted: Mon May 26, 2014 7:23 pm Post subject: |
|
|
I think we should post trading lessons in separate thread "trading lessons" or so named thread so that it can be referred to later ....and all are in one place
| welgro wrote: | Exact Swing Points -Support And Resistance
Where exactly are the support and resistance points?
Where exactly are the swing points on a chart?
This is a particularly important lesson!
Just about every system or method of trading at least takes note of where the key support and resistance levels are.
I have found a double use for my method of identifying these points - They are also Swing Points!
You may think you know where Support and Resistance is, but do you really?
How do you know where support and resistance really is?
The problem with Support and Resistance (S&R) is that it is not a definite number. It is not an exact point on the chart at which price will, without any hesitation stop.
In fact S&R is actually an area - it is not an exact number as we would all like to think.
The dilemma of course, is that in order to do our calculations we need an exact point. You can't enter $50.10/20 area when using fibonacci or working out your stops and limits. You need an exact number even though S&R is not an exact number.
Try telling your broker that you want a stop loss at somewhere between 50 and 55 and watch him burst a blood vessel.
This is what I want to concentrate on in this lesson. This is a technique I have found to be particularly good at not only identifying strong S&R points but also swing points.
In order to find S&R we must first identify market swing points. There are various ways of doing this but I am going to use the one I have used for years.
Swing Up
For the purpose of swing points we are not interested in the open or close of the bars only the high and low.
Take any bar and think of that bar as the start bar (S). If there are two consecutive higher highs than the bar you marked (S) then that is a swing up e.g. bar (1) has a higher high than bar (S) and bar (2) has a higher high than bar (1). If there are not two higher highs than bar (S) then you move to the next bar and see if there are two consecutive higher highs.
This can be particularly useful if the market is trading sideways and you are trying to determine the breakout point. There may be many peaks and valleys but for me there is only one real point - that is the most recent swing up or swing down.
Look at the next diagram
You can see that although there were a few highs and lows that you could have taken as support or resistance, but it wasn't until bar (M) that a definite swing point had been identified and you could mark bar (K) with an (S).
Swing Down
To work out the swing down point - take any bar on a chart and think of that bar as your start point - bar (S). If the next two consecutive bars make lower lows than the previous bar then that is a swing down e.g. bar (1) has a lower low than bar (S) and bar (2) has a lower low then bar (1). If there are not two consecutive lower lows then it is not a swing point and you move to the next bar.
Just as in the example above you can see exactly the same thing with the swing down. Even though price made a few highs and lows it wasn't until bar (M) that you could mark bar (K) as the (S) point.
Support And Resistance
Only once we have clearly marker swing points can we go on to identify our support and resistance points.
As you can see from the chart I have marked all the swing up points and swing down points. When we are in a down trend then the swing down points act as resistance and when we are in an up trend the swing up points
act as support.
Marking the support and resistance points using this method of first identifying the swing points will give you definite points on a chart from which to calculate your stops, limits and projections.
Copy paste |
|
|
| Back to top |
|
|
vinay28
Black Belt
Joined: 24 Dec 2010
Posts: 11748
|
| Post: #262 Posted: Mon May 26, 2014 7:58 pm Post subject: |
|
|
Nifty for Tuesday (27/05/14)
Supports are at about 7318, 7273, 7225, 7198 and 7100 while resistances are at about 7403, 7421, 7457 and 7496. Previous low to watch for is at about 7206. A +WW can give about 7504 (once above 7431) (+WWs with higher targets are not mentioned as of now). Two -WWs can give about 7209 (once below 7341) and 7000 (once below 7304) (-WWs with much lower targets are not mentioned as of now). A bearish flag can give lower level unless killed above 7415.
Nifty fell sharply after a big gap up open and further rise and closed flat but just above 7350 and now looks bearish. Daily candle is bearish engulfing but is also a doji. Also, there is mild -ve div on daily chart. A break below 7300 again will be the first warning but a close below about 7230 could cause further fall. Only crossing above 7450 can take nifty further up. Being an expiry week, trade carefully. |
|
| Back to top |
|
|
kishjk7551
White Belt

Joined: 26 Jan 2008
Posts: 293
|
| Post: #263 Posted: Mon May 26, 2014 11:17 pm Post subject: |
|
|
| welgro wrote: | 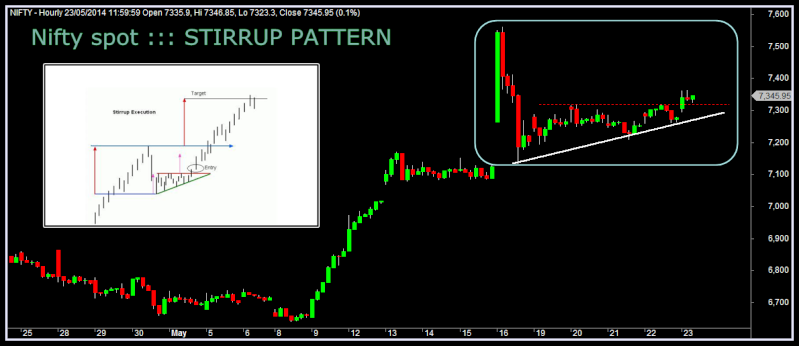
Nifty spot if hold above 7300 then we may see 7994.00 |
Hi Welgro today nifty did break 7300 , do you still think it may go to 7994.
Regards |
|
| Back to top |
|
|
welgro
Brown Belt
Joined: 24 Sep 2012
Posts: 1784
|
| Post: #264 Posted: Mon May 26, 2014 11:27 pm Post subject: |
|
|
[quote="kishjk7551"] | welgro wrote: |
Hi Welgro today nifty did break 7300 , do you still think it may go to 7994.
Regards |
Stoploss Hit. |
|
| Back to top |
|
|
welgro
Brown Belt
Joined: 24 Sep 2012
Posts: 1784
|
| Post: #265 Posted: Tue May 27, 2014 9:02 am Post subject: |
|
|
 |
|
| Back to top |
|
|
dynamite_munda11
Yellow Belt

Joined: 14 Nov 2010
Posts: 681
|
| Post: #266 Posted: Tue May 27, 2014 9:23 am Post subject: nifty fut intraday 27/05/2014 |
|
|
nifty fut intraday 27/05/2014
nifty fut at the moment long above 7321.15 trgts 7333/7349 with stop below 7304/7310/7314 |
|
| Back to top |
|
|
dynamite_munda11
Yellow Belt
Joined: 14 Nov 2010
Posts: 681
|
| Post: #267 Posted: Tue May 27, 2014 9:29 am Post subject: nifty fut intraday 27/05/2014 |
|
|
book par at or near 7349
more upside only above 7349
sustaing 7349 nf can trgt 7367/74/78/85/92 |
|
| Back to top |
|
|
saurabhkurichh
White Belt
Joined: 30 Oct 2006
Posts: 127
|
| Post: #268 Posted: Tue May 27, 2014 12:40 pm Post subject: |
|
|
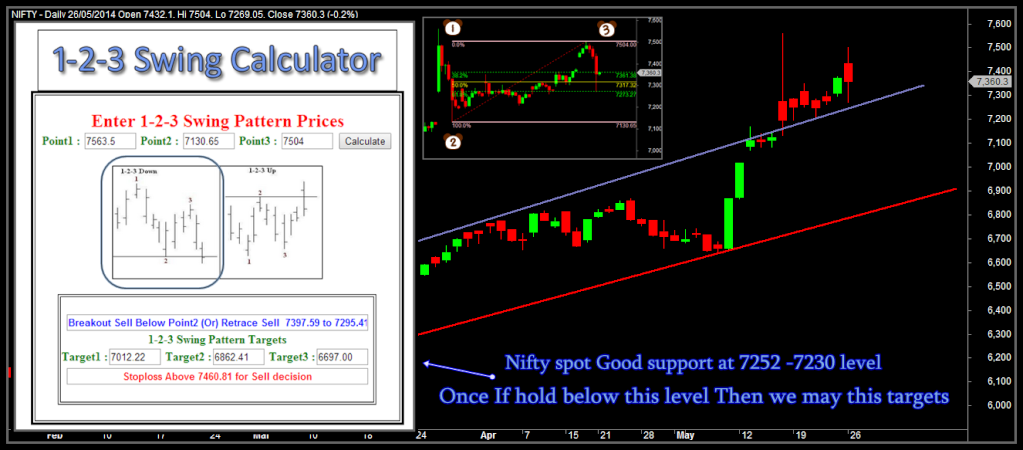
wonderful explational that u give with charts.. Un paralleled ....
Point 2 needs to be broken first  for those targets! for those targets! |
|
| Back to top |
|
|
welgro
Brown Belt
Joined: 24 Sep 2012
Posts: 1784
|
| Post: #269 Posted: Tue May 27, 2014 4:45 pm Post subject: |
|
|
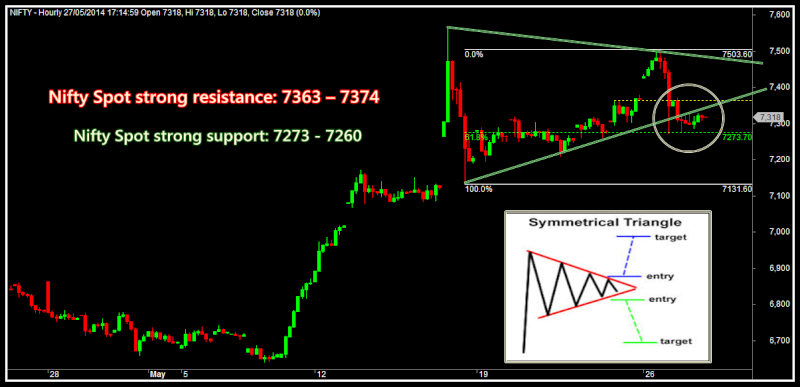
Nifty spot currently is in downtrend (Intraday trend).
I am holding short positions for downside target 6868.
But nifty spot seems some strong support at 7272 levels (Fibonacci Golden ratio).
if its hold below the golden ratio level then no problems for nifty downside rally.
Nifty spot have strong resistance at 7373 level (Previous day high)
incase nifty spot if its trade and hold above 7374 then
I will exit my all short positions at the same time I will take fresh long positions in June contract for upside target: 7660. Stop loss will be 7260 (recent swing low).
~~~~~~~~~~~~~~~~~
 |
|
| Back to top |
|
|
vinay28
Black Belt
Joined: 24 Dec 2010
Posts: 11748
|
| Post: #270 Posted: Tue May 27, 2014 5:09 pm Post subject: |
|
|
Nifty for Wednesday (28/05/14)
Supports are at about 7288, 7250, 7220 and 7128 while resistances are at about 7334, 7360, 7381 and 7438. Previous low to watch for is at about 7206. Three +WWs can give about 7408 (once above 7284), 7432 (once above 7264) and 7486 (once above 7405) (+WWs with higher targets are not mentioned as of now). A -WW can give about 7181 (once below 7350) (-WWs with much lower targets are not mentioned as of now). A bearish flag can give lower level unless killed above 7410.
Nifty fell again to close just above 7300 and is bearish. Daily candle is an inside bar. Crucial levels on the higher side are 7334 and 7381 above which nifty can make fresh highs while those on lower side are 7288 and 7220 below which it can make fresh lows. Being an expiry week, trade carefully.
If PCR is 0.83 or lower, nifty may go up. |
|
| Back to top |
|
|
|


