| View previous topic :: View next topic |
| Author |
NIFTY WORKING WITH NATURAL LAW OF GANN.... |
saumya12
Brown Belt

Joined: 21 Dec 2011
Posts: 1509
|
Post: #91  Posted: Sun Sep 02, 2012 2:08 pm Post subject: Posted: Sun Sep 02, 2012 2:08 pm Post subject: |
 |
|
Please do comment also
What does the chart indicate
Regards
|
|
| Back to top |
|
 |
|
|
 |
Dkaur
White Belt

Joined: 16 Jul 2011
Posts: 85
|
Post: #92  Posted: Sun Sep 02, 2012 2:22 pm Post subject: Posted: Sun Sep 02, 2012 2:22 pm Post subject: |
 |
|
| saumya12 wrote: | Please do comment also
What does the chart indicate
Regards |
This chart is a continuous part of the last chart i posted.
Look Saumya the trade is in my favour as i shorted @ 5440 levels partially booked @ 5275. According to gann angle, nifty should go to 5085 & then 4965 levels. But i will exit @ my tsl which is 10 points above friday's high. Lets see
|
|
| Back to top |
|
 |
saumya12
Brown Belt

Joined: 21 Dec 2011
Posts: 1509
|
Post: #93  Posted: Sun Sep 02, 2012 2:46 pm Post subject: Posted: Sun Sep 02, 2012 2:46 pm Post subject: |
 |
|
| Dkaur wrote: | | saumya12 wrote: | Please do comment also
What does the chart indicate
Regards |
This chart is a continuous part of the last chart i posted.
Look Saumya the trade is in my favour as i shorted @ 5440 levels partially booked @ 5275. According to gann angle, nifty should go to 5085 & then 4965 levels. But i will exit @ my tsl which is 10 points above friday's high. Lets see |
Thanks DK
I am sorry that I just forgot your previous post on Nifty. I read your previous post when you posted it.
I have a suggestion or you can say a request, to do a basic writeup on Gann angle 2x1 and what are the basic parameters/indications to read a chart (so that a layman can understand gann angle). What does the cross of angles generated from 2 different points indicate. How to generate charts or from where one can get charts/charting software.
Or you may provide a link from where one can get basic knowledge on gann angle.
Regards
|
|
| Back to top |
|
 |
sruthi_kulkrni
White Belt

Joined: 06 Jun 2012
Posts: 48
|
Post: #94  Posted: Sun Sep 02, 2012 4:19 pm Post subject: Posted: Sun Sep 02, 2012 4:19 pm Post subject: |
 |
|
| saumya12 wrote: | | Dkaur wrote: | | saumya12 wrote: | Please do comment also
What does the chart indicate
Regards |
This chart is a continuous part of the last chart i posted.
Look Saumya the trade is in my favour as i shorted @ 5440 levels partially booked @ 5275. According to gann angle, nifty should go to 5085 & then 4965 levels. But i will exit @ my tsl which is 10 points above friday's high. Lets see |
Thanks DK
I am sorry that I just forgot your previous post on Nifty. I read your previous post when you posted it.
I have a suggestion or you can say a request, to do a basic writeup on Gann angle 2x1 and what are the basic parameters/indications to read a chart (so that a layman can understand gann angle). What does the cross of angles generated from 2 different points indicate. How to generate charts or from where one can get charts/charting software.
Or you may provide a link from where one can get basic knowledge on gann angle.
Regards |
hello saumya didi,
am amazed with ur interest in gann angles..ppl who dedicate themself to markets they r the ultimate winners....hardwork PAYS...
plz find your time to read Richard smitten-"trade like jessy livermore"..ppl who want to make serious money in markets will definetly find their route to success frm this book ...
|
|
| Back to top |
|
 |
Dkaur
White Belt

Joined: 16 Jul 2011
Posts: 85
|
Post: #95  Posted: Sun Sep 16, 2012 11:17 am Post subject: nifty Posted: Sun Sep 16, 2012 11:17 am Post subject: nifty |
 |
|
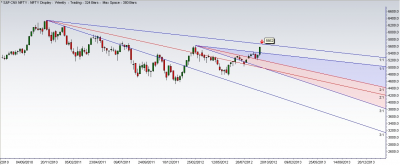
Nifty is taking support exactly @ gann angles. Now the resistence for nifty is @ 5662 lets see what happens..... A short can be initiated @ 5660 levels with SL according to their risk appetite. See the attached chart.
| Description: |
|
| Filesize: |
261.63 KB |
| Viewed: |
589 Time(s) |
|
|
|
| Back to top |
|
 |
Dkaur
White Belt

Joined: 16 Jul 2011
Posts: 85
|
Post: #96  Posted: Sun Sep 16, 2012 11:48 am Post subject: TCS Posted: Sun Sep 16, 2012 11:48 am Post subject: TCS |
 |
|
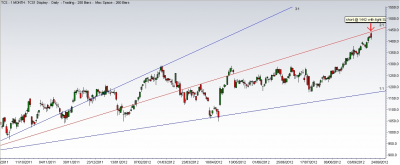
TCS is @ resistece level.
| Description: |
|
| Filesize: |
264.15 KB |
| Viewed: |
532 Time(s) |
|
Last edited by Dkaur on Sun Sep 16, 2012 11:54 am; edited 1 time in total |
|
| Back to top |
|
 |
Dkaur
White Belt

Joined: 16 Jul 2011
Posts: 85
|
Post: #97  Posted: Sun Sep 16, 2012 11:52 am Post subject: SBIN Posted: Sun Sep 16, 2012 11:52 am Post subject: SBIN |
 |
|
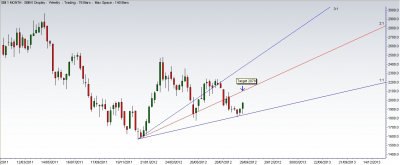
SBIN_weekly chart how beautifully it is taking support @ gann angles. Earlier I already posted a chart for sbin in another thread (Positional By Umesh) From 1816 to 1978.
| Description: |
|
| Filesize: |
210.56 KB |
| Viewed: |
584 Time(s) |
|
|
|
| Back to top |
|
 |
umesh1
Brown Belt

Joined: 24 Nov 2008
Posts: 1974
|
Post: #98  Posted: Sun Sep 16, 2012 1:34 pm Post subject: Re: SBIN Posted: Sun Sep 16, 2012 1:34 pm Post subject: Re: SBIN |
 |
|
| Dkaur wrote: | | SBIN_weekly chart how beautifully it is taking support @ gann angles. Earlier I already posted a chart for sbin in another thread (Positional By Umesh) From 1816 to 1978. |
Dkaur
Appreciate your valuable input in positional thread,Positionals always rock has been proved time and again.looking forward for more updates,
regards
Umesh
|
|
| Back to top |
|
 |
ridinghood
Yellow Belt

Joined: 16 Apr 2009
Posts: 724
|
Post: #99  Posted: Sun Sep 16, 2012 4:03 pm Post subject: Posted: Sun Sep 16, 2012 4:03 pm Post subject: |
 |
|
| Quote: | | Nifty is taking support exactly @ gann angles. Now the resistence for nifty is @ 5662 lets see what happens..... A short can be initiated @ 5660 levels with SL according to their risk appetite. See the attached chart. |
hi dakur,
pl confirm if the level mentioned is that of spot or fuuture?
regs
ridinghood
|
|
| Back to top |
|
 |
umesh1
Brown Belt

Joined: 24 Nov 2008
Posts: 1974
|
Post: #100  Posted: Sun Sep 16, 2012 6:25 pm Post subject: Posted: Sun Sep 16, 2012 6:25 pm Post subject: |
 |
|
| sruthi_kulkrni wrote: | | saumya12 wrote: | | Dkaur wrote: | | saumya12 wrote: | Please do comment also
What does the chart indicate
Regards |
This chart is a continuous part of the last chart i posted.
Look Saumya the trade is in my favour as i shorted @ 5440 levels partially booked @ 5275. According to gann angle, nifty should go to 5085 & then 4965 levels. But i will exit @ my tsl which is 10 points above friday's high. Lets see |
Thanks DK
I am sorry that I just forgot your previous post on Nifty. I read your previous post when you posted it.
I have a suggestion or you can say a request, to do a basic writeup on Gann angle 2x1 and what are the basic parameters/indications to read a chart (so that a layman can understand gann angle). What does the cross of angles generated from 2 different points indicate. How to generate charts or from where one can get charts/charting software.
Or you may provide a link from where one can get basic knowledge on gann angle.
Regards |
hello saumya didi,
am amazed with ur interest in gann angles..ppl who dedicate themself to markets they r the ultimate winners....hardwork PAYS...
plz find your time to read Richard smitten-"trade like jessy livermore"..ppl who want to make serious money in markets will definetly find their route to success frm this book ... |
AN EXTRACT FROM JESSE LIVERMORE
Yes, even veteran traders still make silly mistakes. Look at
Jesse Livermore ( and I suggest you not only read this book, but
study and fear the way this guy operated). Livermore was a stock and
commodity trader way back in the early 1900's. He ran a small shoestring
account into several millions but kept losing it. On the one
hand he was one of the greatest traders to have ever lived, yet on
the hand he was dangerous in that he could not control his emotions.
Having run an account up to millions and then losing it, one would
think this experience was painful enough so as not to be repeated?
Yet when he painfully started from scratch, built his account into
several million again, only to lose it in one bad trade, then the
alarm bells should have been ringing. Any-one can make a mistake
but to not learn from it is fatal. Sadly, after repeating this event
one more time he could not face the thought of making a come-back
Regards
|
|
| Back to top |
|
 |
Dkaur
White Belt

Joined: 16 Jul 2011
Posts: 85
|
Post: #101  Posted: Sun Sep 16, 2012 8:37 pm Post subject: Posted: Sun Sep 16, 2012 8:37 pm Post subject: |
 |
|
| ridinghood wrote: | | Quote: | | Nifty is taking support exactly @ gann angles. Now the resistence for nifty is @ 5662 lets see what happens..... A short can be initiated @ 5660 levels with SL according to their risk appetite. See the attached chart. |
hi dakur,
pl confirm if the level mentioned is that of spot or fuuture?
regs
ridinghood |
Ringhood the levels are for nifty spot, sbi, tcs all are cash levels
|
|
| Back to top |
|
 |
ridinghood
Yellow Belt

Joined: 16 Apr 2009
Posts: 724
|
Post: #102  Posted: Sun Sep 16, 2012 9:39 pm Post subject: Posted: Sun Sep 16, 2012 9:39 pm Post subject: |
 |
|
| Quote: | ridinghood wrote:
Quote:
Nifty is taking support exactly @ gann angles. Now the resistence for nifty is @ 5662 lets see what happens..... A short can be initiated @ 5660 levels with SL according to their risk appetite. See the attached chart.
hi dakur,
pl confirm if the level mentioned is that of spot or fuuture?
regs
ridinghood
Ringhood the levels are for nifty spot, sbi, tcs all are cash levels |
thnx, dkur!
regs
ridinghood
|
|
| Back to top |
|
 |
shahrachit
White Belt

Joined: 12 Jul 2012
Posts: 117
|
Post: #103  Posted: Mon Sep 17, 2012 9:22 am Post subject: Re: SBIN Posted: Mon Sep 17, 2012 9:22 am Post subject: Re: SBIN |
 |
|
| Dkaur wrote: | | SBIN_weekly chart how beautifully it is taking support @ gann angles. Earlier I already posted a chart for sbin in another thread (Positional By Umesh) From 1816 to 1978. |
Thanks for posting.
|
|
| Back to top |
|
 |
Dkaur
White Belt

Joined: 16 Jul 2011
Posts: 85
|
Post: #104  Posted: Tue Sep 18, 2012 9:03 pm Post subject: TCS Posted: Tue Sep 18, 2012 9:03 pm Post subject: TCS |
 |
|
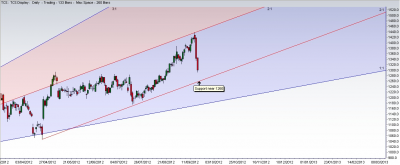
Wow what a short exactly @ the top.Now the support seems @ 1260-1265 levels. If this level gets broken then next support @ 1177.
All these are cash levels.
| Description: |
|
| Filesize: |
263.83 KB |
| Viewed: |
519 Time(s) |
|
|
|
| Back to top |
|
 |
Dkaur
White Belt

Joined: 16 Jul 2011
Posts: 85
|
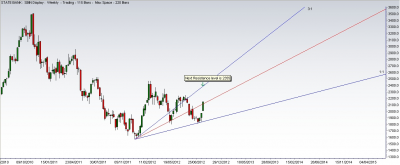
Post: #105  Posted: Tue Sep 18, 2012 9:17 pm Post subject: SBIN Posted: Tue Sep 18, 2012 9:17 pm Post subject: SBIN |
 |
|
The next resistance level for SBIN is 2385 as the price has closed above the 2X1 angle. From 1815 to 2150 WOW
| Description: |
|
| Filesize: |
217.35 KB |
| Viewed: |
559 Time(s) |
|
|
|
| Back to top |
|
 |
|

