| View previous topic :: View next topic |
| Author |
NS METHOD ..NOTABLE STRENGTH METHOD OF TRADING FOR ALL TIME |
nsinojia
Yellow Belt

Joined: 21 Dec 2009
Posts: 624
|
Post: #31  Posted: Sat Aug 27, 2011 11:23 pm Post subject: just read basic to trading mondset Posted: Sat Aug 27, 2011 11:23 pm Post subject: just read basic to trading mondset |
 |
|
just read basic to trading mondset
Last edited by nsinojia on Tue Nov 08, 2011 6:29 pm; edited 1 time in total |
|
| Back to top |
|
 |
|
|
 |
nsinojia
Yellow Belt

Joined: 21 Dec 2009
Posts: 624
|
Post: #32  Posted: Sun Aug 28, 2011 8:03 pm Post subject: Re: NS METHOD HUMAN PSYCOLOGY AND MARKET MOVES Posted: Sun Aug 28, 2011 8:03 pm Post subject: Re: NS METHOD HUMAN PSYCOLOGY AND MARKET MOVES |
 |
|
| nsinojia wrote: | | nsinojia wrote: | | sambhaji_t wrote: | VERY VERY USEFUL JOB DONE BY YOU. YOUR SINCERE EFFORTS ARE HIGHLY APPRECIATED. DO COMPLETE THE ALL ASPECTS AS AND WHEN WHEN YOU GET THE TIME. WE ALL BE REGRETFUL TO YOU AS ALWAYS.
 |
|
|
|
|
| Back to top |
|
 |
nsinojia
Yellow Belt

Joined: 21 Dec 2009
Posts: 624
|
Post: #33  Posted: Sun Oct 16, 2011 7:11 pm Post subject: Re: NS METHOD ..NOTABLE STRENGTH METHOD OF TRADING FOR ALL T Posted: Sun Oct 16, 2011 7:11 pm Post subject: Re: NS METHOD ..NOTABLE STRENGTH METHOD OF TRADING FOR ALL T |
 |
|
| nsinojia wrote: | NS METHOD…NOTABLE STRENGTH METHOD FOR TRADING ALL TF
QUATABLE QUOTE (1) BELIEVE YOUR HEART AND NOT MIND ..MIND CANN’T BE DESTROYED ..HEART DOES.
(2) OBSERVE..IDENTIFY..EVALUATE.. EXECUTE WITH YOUR OWN LIMITATION.
NS METHOD:-
PART (1) IDENTIFYING CANDLE STICK PATTERNS
PART (2) HOW MOVING AVERAGE AND OCCILATORS WORKS
PART(3) HUMAN PHYCOLOGY AND MARKETS MOVES
PART(4) EDUCATION BOOKS AND CHARTS
JUST WANTED TO SHARE WHY I M SUCCESSFUL AS TRADER SINCE 2007 AND INVESTOR SINCE 1992
PART(1) IMPORTANT PATTERNS ..I MAY ADD FEW MORE |
[/b] TECHNICAL ANALYSIS MADE EASY [/b]
| Description: |
|

Download |
| Filename: |
TECHNICAL ANALYSIS.doc |
| Filesize: |
232.5 KB |
| Downloaded: |
649 Time(s) |
|
|
| Back to top |
|
 |
nsinojia
Yellow Belt

Joined: 21 Dec 2009
Posts: 624
|
Post: #34  Posted: Sun Oct 16, 2011 7:15 pm Post subject: Re: NS METHoD TECHNICAL ANALYSIS Posted: Sun Oct 16, 2011 7:15 pm Post subject: Re: NS METHoD TECHNICAL ANALYSIS |
 |
|
| nsinojia wrote: | | nsinojia wrote: | NS METHOD…NOTABLE STRENGTH METHOD FOR TRADING ALL TF
QUATABLE QUOTE (1) BELIEVE YOUR HEART AND NOT MIND ..MIND CANN’T BE DESTROYED ..HEART DOES.
(2) OBSERVE..IDENTIFY..EVALUATE.. EXECUTE WITH YOUR OWN LIMITATION.
NS METHOD:-
PART (1) IDENTIFYING CANDLE STICK PATTERNS
PART (2) HOW MOVING AVERAGE AND OCCILATORS WORKS
PART(3) HUMAN PHYCOLOGY AND MARKETS MOVES
PART(4) EDUCATION BOOKS AND CHARTS
JUST WANTED TO SHARE WHY I M SUCCESSFUL AS TRADER SINCE 2007 AND INVESTOR SINCE 1992
PART(1) IMPORTANT PATTERNS ..I MAY ADD FEW MORE |
[/b] TECHNICAL ANALYSIS MADE EASY [/b] |
|
|
| Back to top |
|
 |
lavotzu
White Belt

Joined: 29 Sep 2011
Posts: 3
|
Post: #35  Posted: Sun Oct 16, 2011 7:24 pm Post subject: Posted: Sun Oct 16, 2011 7:24 pm Post subject: |
 |
|
 pahle kyom nahi bola????? better late than never pahle kyom nahi bola????? better late than never 
|
|
| Back to top |
|
 |
aromal
White Belt

Joined: 22 Mar 2010
Posts: 302
|
Post: #36  Posted: Thu Nov 03, 2011 2:25 pm Post subject: Posted: Thu Nov 03, 2011 2:25 pm Post subject: |
 |
|
hi all 
|
|
| Back to top |
|
 |
nsinojia
Yellow Belt

Joined: 21 Dec 2009
Posts: 624
|
Post: #37  Posted: Sat Nov 05, 2011 3:58 pm Post subject: Re: NS METHOD ..NOTABLE STRENGTH METHOD OF TRADING FOR ALL T Posted: Sat Nov 05, 2011 3:58 pm Post subject: Re: NS METHOD ..NOTABLE STRENGTH METHOD OF TRADING FOR ALL T |
 |
|
| nsinojia wrote: | | nsinojia wrote: | NS METHOD…NOTABLE STRENGTH METHOD FOR TRADING ALL TF
QUATABLE QUOTE (1) BELIEVE YOUR HEART AND NOT MIND ..MIND CANN’T BE DESTROYED ..HEART DOES.
(2) OBSERVE..IDENTIFY..EVALUATE.. EXECUTE WITH YOUR OWN LIMITATION.
NS METHOD:-
PART (1) IDENTIFYING CANDLE STICK PATTERNS
PART (2) HOW MOVING AVERAGE AND OCCILATORS WORKS
PART(3) HUMAN PHYCOLOGY AND MARKETS MOVES
PART(4) EDUCATION BOOKS AND CHARTS
JUST WANTED TO SHARE WHY I M SUCCESSFUL AS TRADER SINCE 2007 AND INVESTOR SINCE 1992
PART(1) IMPORTANT PATTERNS ..I MAY ADD FEW MORE |
[/b] TECHNICAL ANALYSIS MADE EASY [/b] |
TECHNICAL ANALYSIS MADE EASY PART 2
| Description: |
|

Download |
| Filename: |
TECHNICAL ANALYSIS part 2.doc |
| Filesize: |
104 KB |
| Downloaded: |
591 Time(s) |
|
|
| Back to top |
|
 |
nsinojia
Yellow Belt

Joined: 21 Dec 2009
Posts: 624
|
|
| Back to top |
|
 |
nsinojia
Yellow Belt

Joined: 21 Dec 2009
Posts: 624
|
|
| Back to top |
|
 |
nsinojia
Yellow Belt

Joined: 21 Dec 2009
Posts: 624
|
Post: #40  Posted: Mon Nov 14, 2011 6:40 pm Post subject: 10 mnts tf intraday trading- multi days 60mnts tf trading Posted: Mon Nov 14, 2011 6:40 pm Post subject: 10 mnts tf intraday trading- multi days 60mnts tf trading |
 |
|
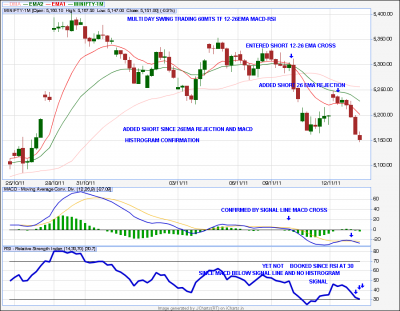
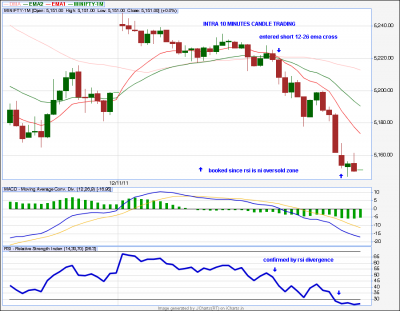
10mnts intraday trading and malti days 60mnts tf trading with 12-26 ema and macd-signal line cross with rsi indicator .... attached chart is self explanatory ... for any questions pls ask
| Description: |
|
| Filesize: |
44.68 KB |
| Viewed: |
646 Time(s) |

|
| Description: |
|
| Filesize: |
37.7 KB |
| Viewed: |
577 Time(s) |

|
|
|
| Back to top |
|
 |
nsinojia
Yellow Belt

Joined: 21 Dec 2009
Posts: 624
|
Post: #41  Posted: Mon Nov 14, 2011 9:01 pm Post subject: Re: 10 mnts tf intraday trading- multi days 60mnts tf tradin Posted: Mon Nov 14, 2011 9:01 pm Post subject: Re: 10 mnts tf intraday trading- multi days 60mnts tf tradin |
 |
|
| nsinojia wrote: | | 10mnts intraday trading and malti days 60mnts tf trading with 12-26 ema and macd-signal line cross with rsi indicator .... attached chart is self explanatory ... for any questions pls ask |
a email of sumesh_sol ... copied and pated here ... From: "Solanki, Sumesh K." <Sumeshsk>
To: nitin sinojia <nsinojia>
Sent: Monday, November 14, 2011 8:39 PM
Subject: RE: pls see macd topic
Thanks a lot sir.. 
I would love to have a live chat session with you.. We shall soon arrange for a mutual convenient time..
Sir, please correct me if I'm wrong in my understanding:
1.) This method works in a continuous trending market, sideways market can give false signals.? (Is there any guideline on minimum nos of candles in prior trend before corssover happens on reverse side ?)
2.) This is applicable to 10/60/eod charts. (which is most error free timeframe ?)
3.) A reversal is identified by 12 ema crossing 26 ema.. (I think this is MUST)
4.) However, entry is only taken when on MACD indicator, macd line has also crossed signal line .. (Is it ALSO must ?)
5.) SL is close above top of candle which lead to crossover (CLOSE is required or only touch will also result in stoploss ?)
5.) Trade can be booked when RSI enters into Oversold zone (below 30) (Is there any other parameter also for booking?)
6.) position can be added on 26 ema rejection. (and for this position , again SL can be set as high of rejection / replied by me (nsinojia) are as follows ... hi sumesh,
1, false signal can be arrested by rsi.
2, this is applicable to 10-30-60 and 120 mnts tf (120mnts on platinum chart os icharts yet to fully functional)
3, yes and macd histrogram confirmation
4 close is required
5 yes for confirmation to close trade see also macd-signal line and histrogram
6 yes ..its better than 34ema with macd and rsi
hope m clear
regards
nitin
|
|
| Back to top |
|
 |
nsinojia
Yellow Belt

Joined: 21 Dec 2009
Posts: 624
|
Post: #42  Posted: Mon Nov 14, 2011 9:09 pm Post subject: Re: 10 mnts tf intraday trading- multi days 60mnts tf tradin Posted: Mon Nov 14, 2011 9:09 pm Post subject: Re: 10 mnts tf intraday trading- multi days 60mnts tf tradin |
 |
|
| nsinojia wrote: | | nsinojia wrote: | | 10mnts intraday trading and malti days 60mnts tf trading with 12-26 ema and macd-signal line cross with rsi indicator .... attached chart is self explanatory ... for any questions pls ask |
a email of sumesh_sol ... copied and pated here ... From: "Solanki, Sumesh K." <Sumeshsk>
To: nitin sinojia <nsinojia>
Sent: Monday, November 14, 2011 8:39 PM
Subject: RE: pls see macd topic
Thanks a lot sir.. 
I would love to have a live chat session with you.. We shall soon arrange for a mutual convenient time..
Sir, please correct me if I'm wrong in my understanding:
1.) This method works in a continuous trending market, sideways market can give false signals.? (Is there any guideline on minimum nos of candles in prior trend before corssover happens on reverse side ?)
2.) This is applicable to 10/60/eod charts. (which is most error free timeframe ?)
3.) A reversal is identified by 12 ema crossing 26 ema.. (I think this is MUST)
4.) However, entry is only taken when on MACD indicator, macd line has also crossed signal line .. (Is it ALSO must ?)
5.) SL is close above top of candle which lead to crossover (CLOSE is required or only touch will also result in stoploss ?)
5.) Trade can be booked when RSI enters into Oversold zone (below 30) (Is there any other parameter also for booking?)
6.) position can be added on 26 ema rejection. (and for this position , again SL can be set as high of rejection / replied by me (nsinojia) are as follows ... hi sumesh,
1, false signal can be arrested by rsi.
2, this is applicable to 10-30-60 and 120 mnts tf (120mnts on platinum chart os icharts yet to fully functional)
3, yes and macd histrogram confirmation
4 close is required
5 yes for confirmation to close trade see also macd-signal line and histrogram
6 yes ..its better than 34ema with macd and rsi
hope m clear
regards
nitin |
 sumesh asks 4.) However, entry is only taken when on MACD indicator, macd line has also crossed signal line .. (Is it ALSO must ?) my reply yes it is must sumesh asks 4.) However, entry is only taken when on MACD indicator, macd line has also crossed signal line .. (Is it ALSO must ?) my reply yes it is must 
|
|
| Back to top |
|
 |
sumesh_sol
Brown Belt

Joined: 06 Jun 2010
Posts: 2344
|
Post: #43  Posted: Mon Nov 14, 2011 9:12 pm Post subject: Re: 10 mnts tf intraday trading- multi days 60mnts tf tradin Posted: Mon Nov 14, 2011 9:12 pm Post subject: Re: 10 mnts tf intraday trading- multi days 60mnts tf tradin |
 |
|
| nsinojia wrote: | | nsinojia wrote: | | 10mnts intraday trading and malti days 60mnts tf trading with 12-26 ema and macd-signal line cross with rsi indicator .... attached chart is self explanatory ... for any questions pls ask |
a email of sumesh_sol ... copied and pated here ... From: "Solanki, Sumesh K." <Sumeshsk>
To: nitin sinojia <nsinojia>
Sent: Monday, November 14, 2011 8:39 PM
Subject: RE: pls see macd topic
Thanks a lot sir.. 
I would love to have a live chat session with you.. We shall soon arrange for a mutual convenient time..
Sir, please correct me if I'm wrong in my understanding:
1.) This method works in a continuous trending market, sideways market can give false signals.? (Is there any guideline on minimum nos of candles in prior trend before corssover happens on reverse side ?)
2.) This is applicable to 10/60/eod charts. (which is most error free timeframe ?)
3.) A reversal is identified by 12 ema crossing 26 ema.. (I think this is MUST)
4.) However, entry is only taken when on MACD indicator, macd line has also crossed signal line .. (Is it ALSO must ?)
5.) SL is close above top of candle which lead to crossover (CLOSE is required or only touch will also result in stoploss ?)
5.) Trade can be booked when RSI enters into Oversold zone (below 30) (Is there any other parameter also for booking?)
6.) position can be added on 26 ema rejection. (and for this position , again SL can be set as high of rejection / replied by me (nsinojia) are as follows ... hi sumesh,
1, false signal can be arrested by rsi.
2, this is applicable to 10-30-60 and 120 mnts tf (120mnts on platinum chart os icharts yet to fully functional)
3, yes and macd histrogram confirmation
4 close is required
5 yes for confirmation to close trade see also macd-signal line and histrogram
6 yes ..its better than 34ema with macd and rsi
hope m clear
regards
nitin |
Thank you once again sir, I will keep you updated on the trades I take using this method and seek your valuable feedback ...
Regards,
Sumesh
|
|
| Back to top |
|
 |
sumesh_sol
Brown Belt

Joined: 06 Jun 2010
Posts: 2344
|
Post: #44  Posted: Mon Nov 14, 2011 9:35 pm Post subject: EDUCOMP Posted: Mon Nov 14, 2011 9:35 pm Post subject: EDUCOMP |
 |
|
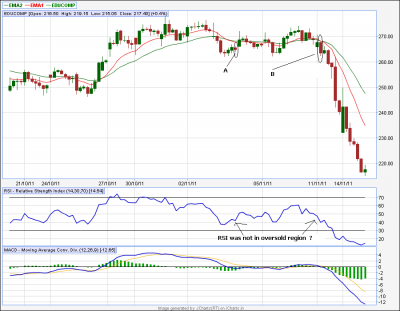
(Trade already over, only for academic purpose...)
Dear Nitin Sir,
Here if you see there were two points (marked as A &B) where short could have been triggered using 12/26 method, but if you see on both the occassions , RSI was below 50 (somewhere near 30). My understanding was to short when on crossover RSI is above 50 (preferably above 70) zone, so that we can see some reasonable fall.
Can u please comment on this.. ?
| Description: |
|
| Filesize: |
55.95 KB |
| Viewed: |
593 Time(s) |

|
|
|
| Back to top |
|
 |
nsinojia
Yellow Belt

Joined: 21 Dec 2009
Posts: 624
|
Post: #45  Posted: Tue Nov 15, 2011 7:36 am Post subject: Posted: Tue Nov 15, 2011 7:36 am Post subject: |
 |
|
| sumesh its clear 12/26 crossover confirmed by macd and signal line and as you observed rsi diverging at that point its a perfect short trade
|
|
| Back to top |
|
 |
|

