| View previous topic :: View next topic |
| Author |
NVK SET UP |
shekharinvest
Yellow Belt

Joined: 21 Dec 2007
Posts: 549
|
Post: #121  Posted: Wed Oct 07, 2009 9:20 am Post subject: Posted: Wed Oct 07, 2009 9:20 am Post subject: |
 |
|
Hello,
JPS, please go to first post by Saikat, in this thread you will get complete answer to your query.
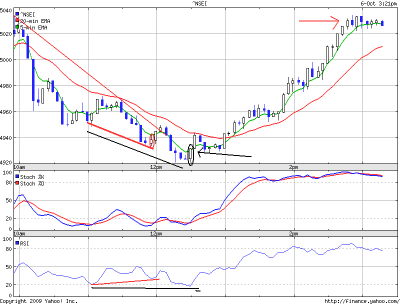
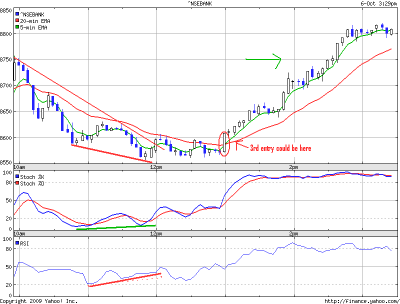
Attached below is the chart for banknifty, clearly showing divergence with RSI as well as STS.
BNF needs a larger space for SL and its moves are larger too, this index is more volatile caution is advised.
Nifty gave opportunity twice to go long first near 4940-45 level and it hit the SL, then again long at 4925-30 level from where it went all the way to make a new high for the day !
SHEKHAR
| Description: |
|
| Filesize: |
12.95 KB |
| Viewed: |
510 Time(s) |

|
| Description: |
|
| Filesize: |
12.93 KB |
| Viewed: |
473 Time(s) |

|
|
|
| Back to top |
|
 |
|
|
 |
natarajmtech
White Belt

Joined: 13 Oct 2008
Posts: 61
|
Post: #122  Posted: Wed Oct 07, 2009 11:41 am Post subject: Posted: Wed Oct 07, 2009 11:41 am Post subject: |
 |
|
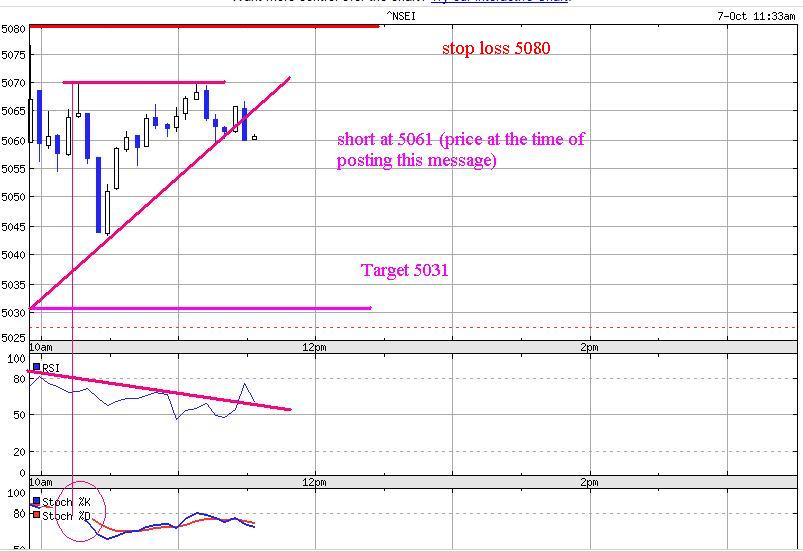
What more conformation wanted ?
Enter for short today ... It is unfortunate that STS crossover could not been visible due to the text on the chart overlap but I belive it should have crossed red line from top
See the attached chart for today
Regards,
Nataraj
| Description: |
|
| Filesize: |
69.64 KB |
| Viewed: |
2229 Time(s) |

|
|
|
| Back to top |
|
 |
simran8998
White Belt

Joined: 19 Mar 2009
Posts: 34
|
Post: #123  Posted: Wed Oct 07, 2009 12:07 pm Post subject: Posted: Wed Oct 07, 2009 12:07 pm Post subject: |
 |
|
| natarajmtech wrote: | What more conformation wanted ?
Enter for short today ... It is unfortunate that STS crossover could not been visible due to the text on the chart overlap but I belive it should have crossed red line from top
See the attached chart for today
Regards,
Nataraj |
This is not the right NVK setup
|
|
| Back to top |
|
 |
natarajmtech
White Belt

Joined: 13 Oct 2008
Posts: 61
|
Post: #124  Posted: Wed Oct 07, 2009 12:13 pm Post subject: Posted: Wed Oct 07, 2009 12:13 pm Post subject: |
 |
|
| natarajmtech wrote: | What more conformation wanted ?
Enter for short today ... It is unfortunate that STS crossover could not been visible due to the text on the chart overlap but I belive it should have crossed red line from top
See the attached chart for today
Regards,
Nataraj |
It looks nifty taking support at around 5055 , the 38.2% fibonnaci retracement level...so book profit around 5056 and reenter after breaking 5054 for a proposed target of 5031.
Regards,
Nataraj
|
|
| Back to top |
|
 |
natarajmtech
White Belt

Joined: 13 Oct 2008
Posts: 61
|
Post: #125  Posted: Wed Oct 07, 2009 12:16 pm Post subject: Posted: Wed Oct 07, 2009 12:16 pm Post subject: |
 |
|
| natarajmtech wrote: | | natarajmtech wrote: | What more conformation wanted ?
Enter for short today ... It is unfortunate that STS crossover could not been visible due to the text on the chart overlap but I belive it should have crossed red line from top
See the attached chart for today
Regards,
Nataraj |
It looks nifty taking support at around 5055 , the 38.2% fibonnaci retracement level...so book profit around 5056 and reenter after breaking 5054 for a proposed target of 5031.
Regards,
Nataraj |
Good the nifty broke 5054..so the target is 5031 or below is confirmed
Regards,
Nataraj
|
|
| Back to top |
|
 |
simran8998
White Belt

Joined: 19 Mar 2009
Posts: 34
|
Post: #126  Posted: Wed Oct 07, 2009 12:19 pm Post subject: Posted: Wed Oct 07, 2009 12:19 pm Post subject: |
 |
|
natarajmtech
How you calculated 5031? it is neither high nor low
|
|
| Back to top |
|
 |
natarajmtech
White Belt

Joined: 13 Oct 2008
Posts: 61
|
Post: #127  Posted: Wed Oct 07, 2009 12:19 pm Post subject: Posted: Wed Oct 07, 2009 12:19 pm Post subject: |
 |
|
| natarajmtech wrote: | | natarajmtech wrote: | | natarajmtech wrote: | What more conformation wanted ?
Enter for short today ... It is unfortunate that STS crossover could not been visible due to the text on the chart overlap but I belive it should have crossed red line from top
See the attached chart for today
Regards,
Nataraj |
It looks nifty taking support at around 5055 , the 38.2% fibonnaci retracement level...so book profit around 5056 and reenter after breaking 5054 for a proposed target of 5031.
Regards,
Nataraj |
Good the nifty broke 5054..so the target is 5031 or below is confirmed
Regards,
Nataraj |
Wow...what a setup.... upon breaking 5054...the nifty dragged to days's low and even going strong on downside...
Simran...why you did not agree with the setup proposed by me today ?
Regards,
Nataraj
|
|
| Back to top |
|
 |
simran8998
White Belt

Joined: 19 Mar 2009
Posts: 34
|
Post: #128  Posted: Wed Oct 07, 2009 12:22 pm Post subject: Posted: Wed Oct 07, 2009 12:22 pm Post subject: |
 |
|
natarajmtech
What was day's low before this setup.
|
|
| Back to top |
|
 |
natarajmtech
White Belt

Joined: 13 Oct 2008
Posts: 61
|
Post: #129  Posted: Wed Oct 07, 2009 12:26 pm Post subject: Posted: Wed Oct 07, 2009 12:26 pm Post subject: |
 |
|
| simran8998 wrote: | natarajmtech
How you calculated 5031? it is neither high nor low |
~5030 was the days' low until the current low of 5023.7 created just a while back. If you do not belive me please see the opening price of nifty today in yahoo RT chart which is still indicating the 5031.7 as the opening price of the nifty
Regards,
Nataraj
|
|
| Back to top |
|
 |
simran8998
White Belt

Joined: 19 Mar 2009
Posts: 34
|
Post: #130  Posted: Wed Oct 07, 2009 12:27 pm Post subject: Posted: Wed Oct 07, 2009 12:27 pm Post subject: |
 |
|
natarajmtech
But it is not showing on chart
|
|
| Back to top |
|
 |
natarajmtech
White Belt

Joined: 13 Oct 2008
Posts: 61
|
Post: #131  Posted: Wed Oct 07, 2009 12:32 pm Post subject: Posted: Wed Oct 07, 2009 12:32 pm Post subject: |
 |
|
| simran8998 wrote: | | natarajmtech wrote: | | simran8998 wrote: | natarajmtech
How you calculated 5031? it is neither high nor low |
~5030 was the days' low until the current low of 5023.7 created just a while back. If you do not belive me please see the opening price of nifty today in yahoo RT chart which is still indicating the 5031.7 as the opening price of the nifty
Regards,
Nataraj |
But it is not showing on chart |
Yes, It is being a problem with yahoo RT chart that I noticed several time, the opening candle is not reflective of actual price movement so I always refer the text posted below the chart for the days' low and high
Regards,
Nataraj
|
|
| Back to top |
|
 |
natarajmtech
White Belt

Joined: 13 Oct 2008
Posts: 61
|
Post: #132  Posted: Thu Oct 08, 2009 1:32 pm Post subject: Posted: Thu Oct 08, 2009 1:32 pm Post subject: |
 |
|
Hi,
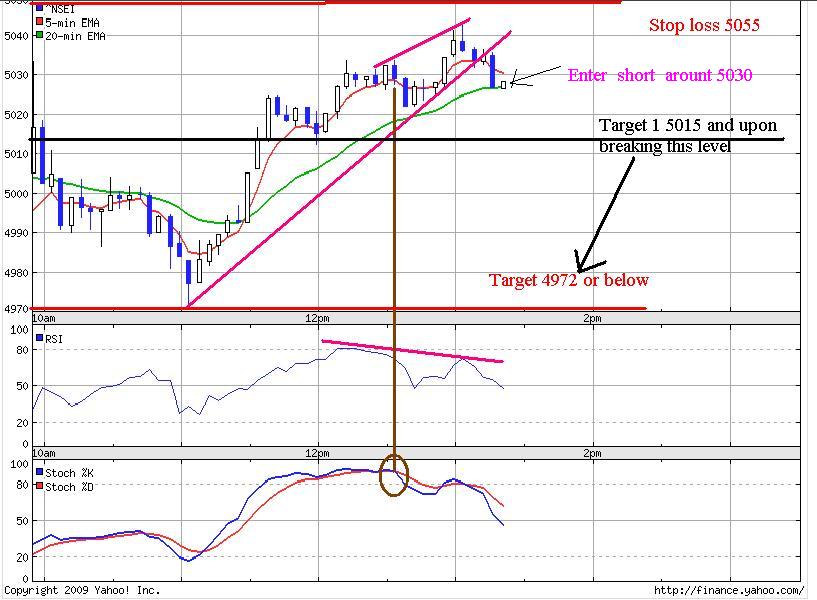
Today's proposed NVK setup along with STS indicator - for a shorting opertunity in nifty future.
See attached plot with this message.
Regards,
Nataraj
| Description: |
|
| Filesize: |
84.82 KB |
| Viewed: |
2377 Time(s) |

|
|
|
| Back to top |
|
 |
simran8998
White Belt

Joined: 19 Mar 2009
Posts: 34
|
Post: #133  Posted: Thu Oct 08, 2009 1:35 pm Post subject: Posted: Thu Oct 08, 2009 1:35 pm Post subject: |
 |
|
Hi, natarajmtech
I am also thinking the same. I want to know why you set Sl @ 5055? why not @ 5045?
Now wait & see whether SL hit or Target hit.

|
|
| Back to top |
|
 |
natarajmtech
White Belt

Joined: 13 Oct 2008
Posts: 61
|
Post: #134  Posted: Thu Oct 08, 2009 1:39 pm Post subject: Posted: Thu Oct 08, 2009 1:39 pm Post subject: |
 |
|
| simran8998 wrote: | Hi, natarajmtech
I am also thinking the same. I want to know why you set Sl @ 5055? why not @ 5045?
Now wait & see whether SL hit or Target hit.
 |
Hi Simran,
Since 10 points above the high of double top is the rule of NVK setup proposed originally by Saikat...so here the top is 4043 and it is also the days' high.
Regards,
Nataraj
|
|
| Back to top |
|
 |
simran8998
White Belt

Joined: 19 Mar 2009
Posts: 34
|
Post: #135  Posted: Thu Oct 08, 2009 1:40 pm Post subject: Posted: Thu Oct 08, 2009 1:40 pm Post subject: |
 |
|
natarajmtech
Thanks for your reply. What do you think whether target will hit or not?
|
|
| Back to top |
|
 |
|

