| View previous topic :: View next topic |
| Author |
NVK SET UP |
shekharinvest
Yellow Belt

Joined: 21 Dec 2007
Posts: 549
|
Post: #16  Posted: Tue Aug 18, 2009 11:51 am Post subject: Posted: Tue Aug 18, 2009 11:51 am Post subject: |
 |
|
Saikat
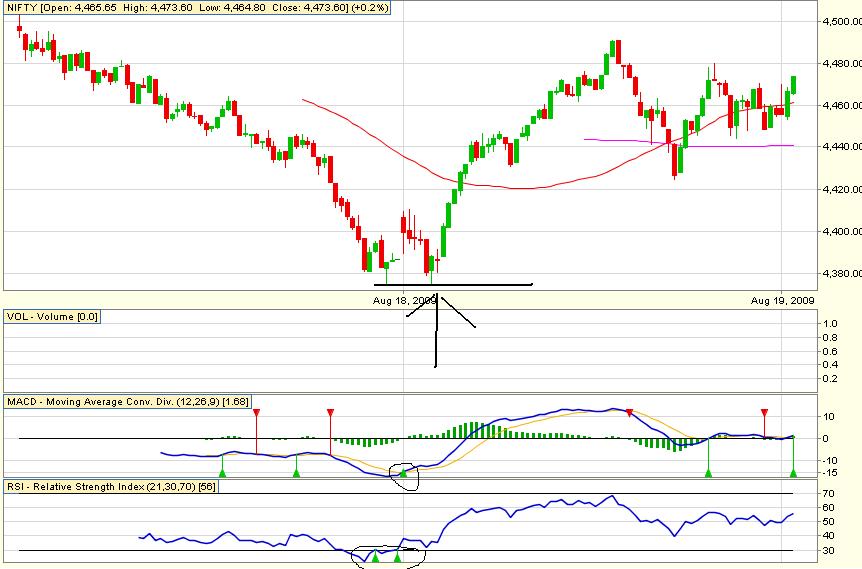
I am posting below chart for NF which happens to be the classic case of divergence failure.
Yesterday night while I was going through Martin Pring on Market Momentum I found remarkable resemblance to the chart posted by him on the divergence failure on RSI with the one posted below although, they are on different time frames and here is what he has to say on the divergence failure –
“it is important to note that, if this trend of improving momentum falters, the consequences are equally as bearish as they were potentially bullish”.
Can we infer, if the target from the point of the divergence was the new high, on the failure of the divergence, it could be same distance below from the point of divergence failure?
I would request fellow boarder to be kind enough to post charts for divergence failure if and when they happen to come across one, on any time frame.
SHEKHAR
NB: Could not post in the morning due to the great network problem ! had to write twice.
| Description: |
|
| Filesize: |
35.5 KB |
| Viewed: |
1176 Time(s) |
|
|
|
| Back to top |
|
 |
|
|
|
kingrahman
White Belt

Joined: 20 Feb 2009
Posts: 5
|
| Post: #17 Posted: Wed Aug 19, 2009 7:50 am Post subject: nvk setup |
|
|
| hi sekarinvest,always look for divergence in the oversold or overbought area.it will be 90% accurate.thanks
|
|
| Back to top |
|
|
shekharinvest
Yellow Belt
Joined: 21 Dec 2007
Posts: 549
|
| Post: #18 Posted: Wed Aug 19, 2009 9:14 am Post subject: |
|
|
HI,
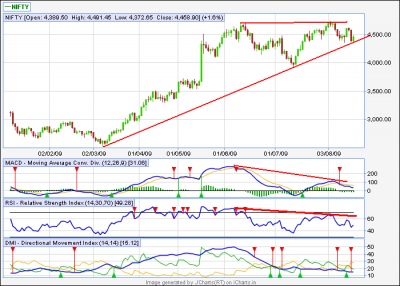
Posted below is the chart for NIFTY SPOT EOD
Following observations are made.
Chart appears to have made double top over a period of three months and the price has taken support on TL from March Lows.
Volumes during the formation of second top are lower (20,000+) than what they were for the previous top (28,000+). (Indicator not shown on the chart)
Negative divergence can be seen on RSI and on MACD closer to zero line which is seen less often (one can see on NIFTY charts for Jan 2008 also).
ADX is at 15 and it may be suggestive of beginning of new trend (direction?) shortly.
PLEASE DRAW YOUR ON CONCLUSIONS.
SHEKHAR
| Description: |
|
| Filesize: |
38.7 KB |
| Viewed: |
1042 Time(s) |
|
|
|
| Back to top |
|
|
kiran.jain
White Belt
Joined: 31 Jan 2008
Posts: 47
Location: mumbai
|
|
| Back to top |
|
|
saikat
White Belt
Joined: 31 Mar 2008
Posts: 317
|
| Post: #20 Posted: Wed Aug 19, 2009 9:03 pm Post subject: |
|
|
Hi Kiran.....
See my post is bringing all oldies back to forum 
NVK sir and now you 
But wow!! wow!!! what an innovation.. You have applied the set up combining 2 days.. and it rocked.
And target??? Why?? It almost got to earlier day high .. 4485 kind.
So it gave cool 100 points with 8-10 points SL.
As I see only Yahoo one day chart - I entirely missed this...
Reagrds,
Saikat
|
|
| Back to top |
|
|
saikat
White Belt
Joined: 31 Mar 2008
Posts: 317
|
| Post: #21 Posted: Wed Aug 19, 2009 9:43 pm Post subject: |
|
|
Hi,
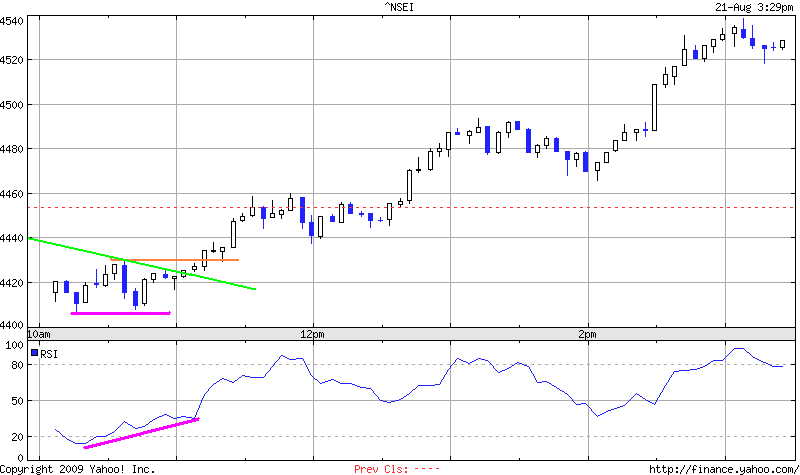
Few Points today -
1) The first set up (high lighted in yellow colour) failed.
2) This set up - as I mentioned in the first post - has good strike ratio when it makes double bottom and not normal divergence (means price going down and RSI Up)
3) The reason might be - price refused to go below earlier low, creates a support there and a horizontal support is far more stronger.
Shekhar -- yes.. any pattern failure means reverse direction movement - that is the basic logic behind having reversible SL
Regards,
Saikat
| Description: |
|
| Filesize: |
48.16 KB |
| Viewed: |
6370 Time(s) |
|
|
|
| Back to top |
|
|
shekharinvest
Yellow Belt
Joined: 21 Dec 2007
Posts: 549
|
| Post: #22 Posted: Thu Aug 20, 2009 9:43 am Post subject: |
|
|
Saikat
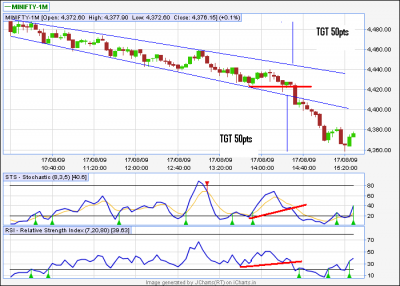
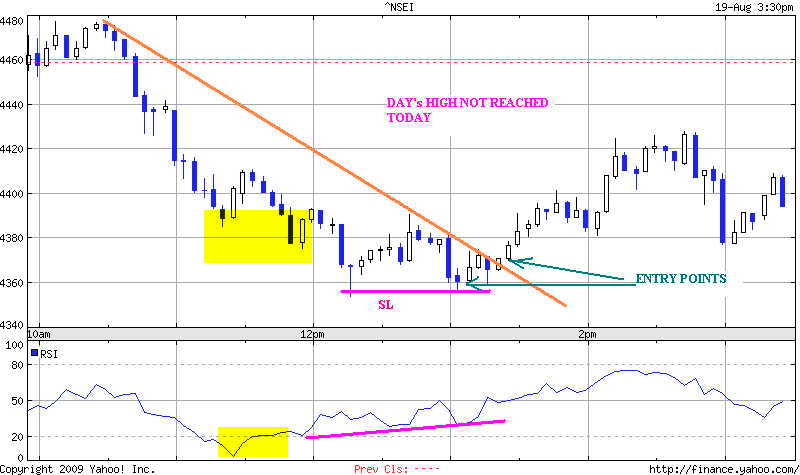
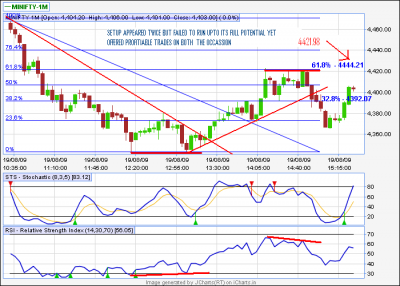
I am posting chart for yestarday as it appeared to me. It offered two setups during the day although it failed to reach its objective both the time. But the trades were profitable. I did not take the second one.
Set up is presented in red lines. I have overlaid the first setup with fibo retracement in blue lines.
What I have understood during the day, in conversion with you is summed up as below
You took the entry closer to the second bottom with SL 5-7 points below the lower of the two bottoms.
You will now hold your position with SL being at the lowest point during the full run of the setup. i.e. either it makes a days new high or let it hit your SL. That’s how you trade.
If some one like me, wants to raise the SL as the setup gives moves in favour of the position one can raise the SL as per fibo levels.
Say, if it retraces 23.6% and the candle closes above it one may bring SL to below it and carry on the process upto all the higher levels it breaches on closing basis alternatively, say, if it closes above 38.2% SL to brought below 23.6% i.e. one level below the level it has breached on closing basis. Which one to follow ?
Saikat, does all the levels carry equal importance or 38.2% and 61.8% are the more important among them.
SHEKHAR
| Description: |
|
| Filesize: |
42.84 KB |
| Viewed: |
1186 Time(s) |
|
|
|
| Back to top |
|
|
anirvanbhadra
White Belt
Joined: 19 Apr 2007
Posts: 13
|
| Post: #23 Posted: Thu Aug 20, 2009 2:32 pm Post subject: |
|
|
@Shekharinvest
I used the same set up that you have pointed out for my intra day long yesterday and i closed it around 4425
|
|
| Back to top |
|
|
saikat
White Belt
Joined: 31 Mar 2008
Posts: 317
|
| Post: #24 Posted: Thu Aug 20, 2009 11:53 pm Post subject: |
|
|
HI Shekhar,
Yes, when I am trading this set up, I normally try to hold it - unless I am feeling itchy or need to go away from screen.
But that is how 'I' play it.... I just presented a set up which I observed for quite a long time and found good. now you can always (and should) customize it as per your other methods... like the way you add positions with rising SL.
Yesterday it retraced to 61.8% ( ie 4422 ) and reversed.
I also didn't trade the 2nd set up as I went out. but it was 100% valid set up.
Regarding SL - I wud prefer the 2nd method - ie one level below - give some room for noises.
But frankly, I have not observed fibo on intra basis, and can't really say.... so you have to observe and decide - which is better.
All fibo levels are important to me - market will give respect to the level - depending upon the strength in it.
Regards,
Saikat
|
|
| Back to top |
|
|
shekharinvest
Yellow Belt
Joined: 21 Dec 2007
Posts: 549
|
| Post: #25 Posted: Fri Aug 21, 2009 9:36 am Post subject: |
|
|
Saikat,
Thnx for your reply.
The setup again appeared today and it did not move neither did the Nifty moved for whole of the day, no fault with the setup 
Saikat, in last couple of the days we have seen this setup coming up again and again, do they come as regularly or it is being seen here in increased number because of the present market situation.
The chart of yesterday is not being posted.
SHEKHAR
|
|
| Back to top |
|
|
archetana
White Belt
Joined: 09 Jun 2009
Posts: 1
|
| Post: #26 Posted: Fri Aug 21, 2009 5:18 pm Post subject: Thanks for the setup, bettered my predictions |
|
|
Thanks Saikat for posting the NVK setup on the forum. Do you also apply any rule to pick stocks, how do i determine which stock has a higher probability for wide range for trading on a given day. Lately all the stocks I am picking are having a very small range.
Regards,
Chetana
|
|
| Back to top |
|
|
saikat
White Belt
Joined: 31 Mar 2008
Posts: 317
|
| Post: #27 Posted: Fri Aug 21, 2009 9:41 pm Post subject: Re: Thanks for the setup, bettered my predictions |
|
|
Hello,
I trade only in very handful of stocks and I am sure you know those.
Try banking / infra / reality stocks - they have good movements.
Also please remember -wide movement might mean more losses too.
Regards,
Saikat
| archetana wrote: | Thanks Saikat for posting the NVK setup on the forum. Do you also apply any rule to pick stocks, how do i determine which stock has a higher probability for wide range for trading on a given day. Lately all the stocks I am picking are having a very small range.
Regards,
Chetana |
|
|
| Back to top |
|
|
saikat
White Belt
Joined: 31 Mar 2008
Posts: 317
|
|
| Back to top |
|
|
saikat
White Belt
Joined: 31 Mar 2008
Posts: 317
|
| Post: #29 Posted: Fri Aug 21, 2009 10:04 pm Post subject: |
|
|
Hi Shekhar,
Yes, I tried to post a set up which appears quite frequently also and as well as has great deal of success rate too. And of course a mind boggling reward to risk ratio too. Risk 10-15 points for reward for anything like 70-150 points profit.
Cool
Regards,
Saikat
| shekharinvest wrote: | Saikat,
Thnx for your reply.
The setup again appeared today and it did not move neither did the Nifty moved for whole of the day, no fault with the setup
Saikat, in last couple of the days we have seen this setup coming up again and again, do they come as regularly or it is being seen here in increased number because of the present market situation.
The chart of yesterday is not being posted.
SHEKHAR |
|
|
| Back to top |
|
|
shekharinvest
Yellow Belt
Joined: 21 Dec 2007
Posts: 549
|
| Post: #30 Posted: Sat Aug 22, 2009 3:33 pm Post subject: |
|
|
Saikat,
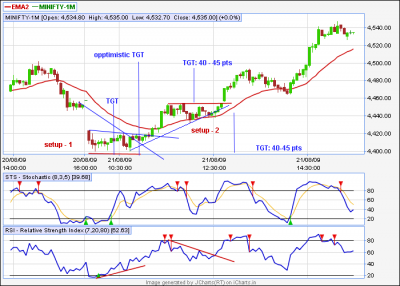
Chart for Friday is posted below.
I have marked two Setup as they appeared to me, the first is the same as posted by you and I could spot it on my chart early. While entering the trade I had a target somewhere closer to the previous closing at the back of my mind, I don’t know why? May be because of the trend line I had drawn from there or being the gap area. There was also an optimistic target as marked on the chart closer to previous intra high, as was posted by Kiran a few days back, but I was doubtful because of the gap area and market being quite bearish. But the market surpassed everything.
I came out at the first target. You would have captured the whole move as you trade.
Setup 2: Although, I did not trade, discussion is purely of academic in nature. This was the case of failed divergence. There was good divergence on the RSI and the price too moved beyond the trend line to trigger the late entry as well, if one could have spotted it late. For the possible target of 40 -45 points to come closer to the days new low. The divergence failed and the price reversed to achieve the same target on the upside, and beyond.
The divergence was to fail this time as the price reversed from the moving average and simultaneously divergence trend line on the RSI was breached, but I could not analyse it during the day. Certainly, I need to put more hard work to be able to analyse real time .
Looking forward to your valuable comments.
SHEKHAR
| Description: |
|
| Filesize: |
45.07 KB |
| Viewed: |
1025 Time(s) |
|
|
|
| Back to top |
|
|
|