| View previous topic :: View next topic |
| Author |
NVK SET UP |
kvram
White Belt

Joined: 31 Mar 2007
Posts: 35
|
Post: #166  Posted: Sat Nov 07, 2009 12:33 pm Post subject: dear natraj Posted: Sat Nov 07, 2009 12:33 pm Post subject: dear natraj |
 |
|
| In yahoo basic chart page we see 5,10,20 etc levels but if we want our specific setups like 3,15,550,1030 etc ,please change to those levels in tool bar ,simple
|
|
| Back to top |
|
 |
|
|
 |
kvram
White Belt

Joined: 31 Mar 2007
Posts: 35
|
Post: #167  Posted: Sat Nov 07, 2009 12:38 pm Post subject: Re: dear natraj Posted: Sat Nov 07, 2009 12:38 pm Post subject: Re: dear natraj |
 |
|
| kvram wrote: | | In yahoo basic chart page we see 5,10,20 etc levels but if we want our specific setups like 3,15,550,1030 etc ,please change to those levels in tool bar ,simple |
|
|
| Back to top |
|
 |
vinst
Black Belt

Joined: 09 Jan 2007
Posts: 3303
|
Post: #168  Posted: Fri Nov 13, 2009 12:38 pm Post subject: Posted: Fri Nov 13, 2009 12:38 pm Post subject: |
 |
|
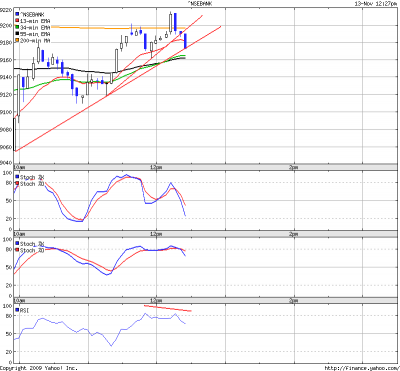
BNF spot in NVK setup to sell (13-nov-2009)
vin
| Description: |
|
| Filesize: |
12.54 KB |
| Viewed: |
438 Time(s) |

|
|
|
| Back to top |
|
 |
shekharinvest
Yellow Belt

Joined: 21 Dec 2007
Posts: 549
|
Post: #169  Posted: Fri Nov 13, 2009 6:08 pm Post subject: Posted: Fri Nov 13, 2009 6:08 pm Post subject: |
 |
|
HI,
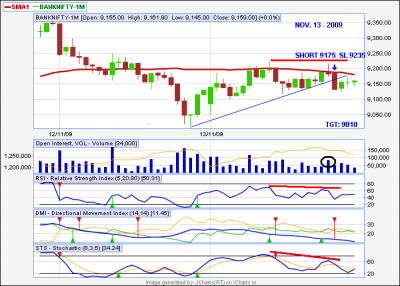
Posted below is the chart for BNF on 15 min TF.
Chart is showing negative divergence at the critical juncture, that is, just below the 50 sma and on both the occasion it has formed inverted hammer with increased volumes. Trendline starting from yesterdays low has been breached convincingly. ADX is quite low at 11 indicating end of consolidation and the start of new trend is nearby. One can reasonably hope that the trade will be fruitful.
SHEKHAR
| Description: |
|
| Filesize: |
42.29 KB |
| Viewed: |
495 Time(s) |

|
|
|
| Back to top |
|
 |
sherbaaz
Yellow Belt

Joined: 27 May 2009
Posts: 543
|
Post: #170  Posted: Sat Nov 14, 2009 10:33 am Post subject: Posted: Sat Nov 14, 2009 10:33 am Post subject: |
 |
|
| shekharinvest wrote: | HI,
Posted below is the chart for BNF on 15 min TF.
Chart is showing negative divergence at the critical juncture, that is, just below the 50 sma and on both the occasion it has formed inverted hammer with increased volumes. Trendline starting from yesterdays low has been breached convincingly. ADX is quite low at 11 indicating end of consolidation and the start of new trend is nearby. One can reasonably hope that the trade will be fruitful.
SHEKHAR |
Hi Shekhar,
I dont think there is any divergence between price and rsi/sts. AS if u see the high of second inverted hammer has lower high (9175.20) than the first inverted hammer high (9224).
With price making LH (Lower High) both incidators are also going the same direction. There is no divergence.
Regards,
Sherbaaz
|
|
| Back to top |
|
 |
vinst
Black Belt

Joined: 09 Jan 2007
Posts: 3303
|
Post: #171  Posted: Sat Nov 14, 2009 11:46 am Post subject: Posted: Sat Nov 14, 2009 11:46 am Post subject: |
 |
|
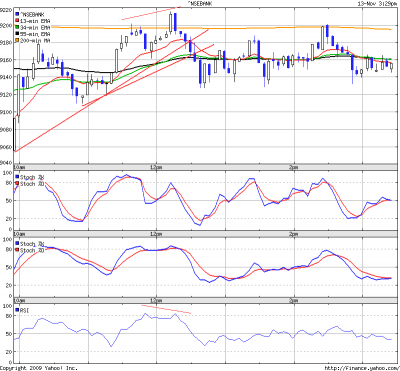
BNF 5 (spot) min chart of 13-Nov-2009.
negative divergence between 11:45 and 12:15. subsequently, setup triggered around 12:30, though did not achieve its usual target.
vin
| Description: |
|
| Filesize: |
16.95 KB |
| Viewed: |
457 Time(s) |

|
|
|
| Back to top |
|
 |
sherbaaz
Yellow Belt

Joined: 27 May 2009
Posts: 543
|
Post: #172  Posted: Sat Nov 14, 2009 12:05 pm Post subject: Posted: Sat Nov 14, 2009 12:05 pm Post subject: |
 |
|
| vinst wrote: | BNF 5 (spot) min chart of 13-Nov-2009.
negative divergence between 11:45 and 12:15. subsequently, setup triggered around 12:30, though did not achieve its usual target.
vin |
Hi Vinst,
The divergence you showed between price and rsi is not a divergence as with the rise in price rsi is not falling (which you have marked as falling).
There is a bearish divergence, but is first STS & price.
Regards,
Sherbaaz
|
|
| Back to top |
|
 |
shekharinvest
Yellow Belt

Joined: 21 Dec 2007
Posts: 549
|
Post: #173  Posted: Sat Nov 14, 2009 3:39 pm Post subject: Posted: Sat Nov 14, 2009 3:39 pm Post subject: |
 |
|
Hi Sherbaaz,
Thanks for your veiws.
I still reiterate my views for the following reasons.
1. The high of the two candles referred to are 9224 and 9215, the candles are formed on 15 min TF Jcharts NEW, ( candles at 12:25 pm and 2:20 pm). The difference between the high price is insignificant 10 points considering the value of BNF at 9000+, double top may be assumed safely.
2. The coressponding values of RSI (5, 20,80) and STS (8,3,5) are more than 15% lower for the corresponding peaks and the divergence is starting from over bought area.
3. Other than the academic details, the setup is quite visible and to be relied on.
Divergences do fail regularly and it can not stop us from trading. Let us leave the rest to the market.
SHEKHAR
| sherbaaz wrote: | | shekharinvest wrote: | HI,
Posted below is the chart for BNF on 15 min TF.
Chart is showing negative divergence at the critical juncture, that is, just below the 50 sma and on both the occasion it has formed inverted hammer with increased volumes. Trendline starting from yesterdays low has been breached convincingly. ADX is quite low at 11 indicating end of consolidation and the start of new trend is nearby. One can reasonably hope that the trade will be fruitful.
SHEKHAR |
Hi Shekhar,
I dont think there is any divergence between price and rsi/sts. AS if u see the high of second inverted hammer has lower high (9175.20) than the first inverted hammer high (9224).
With price making LH (Lower High) both incidators are also going the same direction. There is no divergence.
Regards,
Sherbaaz |
|
|
| Back to top |
|
 |
saikat
White Belt

Joined: 31 Mar 2008
Posts: 317
|
|
| Back to top |
|
 |
Ravi_S
Yellow Belt

Joined: 15 Jun 2009
Posts: 569
|
Post: #175  Posted: Sun Nov 22, 2009 3:45 pm Post subject: Posted: Sun Nov 22, 2009 3:45 pm Post subject: |
 |
|
Last edited by Ravi_S on Fri Dec 18, 2009 9:06 am; edited 1 time in total |
|
| Back to top |
|
 |
Ravi_S
Yellow Belt

Joined: 15 Jun 2009
Posts: 569
|
Post: #176  Posted: Sun Nov 22, 2009 4:02 pm Post subject: Posted: Sun Nov 22, 2009 4:02 pm Post subject: |
 |
|
Last edited by Ravi_S on Fri Dec 18, 2009 9:07 am; edited 1 time in total |
|
| Back to top |
|
 |
sherbaaz
Yellow Belt

Joined: 27 May 2009
Posts: 543
|
Post: #177  Posted: Wed Dec 02, 2009 2:58 pm Post subject: Posted: Wed Dec 02, 2009 2:58 pm Post subject: |
 |
|
Hi Ravi,
Nice efforts putting the divergence in a logical manner. Start a new thread with the same name the i think people would be more benefitted.
Saw the charts which you have attached. I might be wrong but apart from TATAMOTORS class A divergence there is no divergence in other two charts.
Another thing use current chart to explain the divergence so that we all would see what is happening after divergence to price we can track the chart and also learn.
Good going keep it up.
Regards,
Sherbaaz
|
|
| Back to top |
|
 |
Ravi_S
Yellow Belt

Joined: 15 Jun 2009
Posts: 569
|
Post: #178  Posted: Fri Dec 18, 2009 9:13 am Post subject: Posted: Fri Dec 18, 2009 9:13 am Post subject: |
 |
|
Hi
I've created a new thread on how to trade divergences... As Sherbaaz suggested did not want to clutter this thread which is specifically for NVK Setup
Regards
Ravi
|
|
| Back to top |
|
 |
venkchandra
White Belt

Joined: 19 Feb 2007
Posts: 14
|
Post: #179  Posted: Sat Dec 19, 2009 6:45 am Post subject: Re: hi Posted: Sat Dec 19, 2009 6:45 am Post subject: Re: hi |
 |
|
| saikat wrote: | Hello,
Hope you all guys are rocking.... 
Here are 2 charts with NVK setup in SWIING Trading 
The short trade (Bajajhind) - I didn't take as I don't do Stock future. But I did happen to book my delivery position @ 240 there.
But the Long one (HCC) I took and it rocked. 
The SETUP and rules for SL and Entry are exactly same as before
I am using 60 minutes TF and the analysis are done on Amibroker.
(I still see lots of charts posted in this thread with absolutely wrong setups. I am simply unable to understand what is there so difficult to understand in this setup.. anyway...... )
The rules for EXIT (profit booking) has been tweaked little bit using FIBO retracements or Extensions. As it is SWING - so I thought it was necessary. I would suggest booking part by part - say
- 30% at 61.8%
- 30% at last top (bottom)
- rest at 161.8 % or TL cut
Good stong charts continuously make 161.8% - so it is worth to keep atleast a part for that. Recent case was RENUKA ( 241 was 161.8% of last swing 217.2 -178.5 ).
Incidently Renuka made this setup (on 60 mins TF) on last friday when it hit 222 at 1 pm. I went long there @ 222.5 and hoping for a fast rebound, placed a square off sell order @ 232.5 (no reason for this figure other than I wanted a nice round figure of 10  ) - and ) - and  Renuka did hit my sqr off order ). Now it may go to 241 again soon. (the chart of Renuka is of 7 minutes TF - just to show the things clearly - but I did take that trade using 60 mins TF only) Renuka did hit my sqr off order ). Now it may go to 241 again soon. (the chart of Renuka is of 7 minutes TF - just to show the things clearly - but I did take that trade using 60 mins TF only)
Cheers !!!!!
Saikat |
|
|
| Back to top |
|
 |
joshiga
White Belt

Joined: 03 Mar 2009
Posts: 19
|
Post: #180  Posted: Sat Dec 19, 2009 9:31 am Post subject: Posted: Sat Dec 19, 2009 9:31 am Post subject: |
 |
|
Hi Saikat,
THanks for the nice explanations on divergence setup.
But, how do you know that the divergence is happening on a particular stock chart. Is there any automatic alert available in amibroker or any other software? Other wise its bit difficult to keep tracking stocks and watch out for divergences.
Girish
|
|
| Back to top |
|
 |
|

