| View previous topic :: View next topic |
| Author |
NVK SET UP |
shekharinvest
Yellow Belt

Joined: 21 Dec 2007
Posts: 549
|
Post: #31  Posted: Fri Aug 28, 2009 5:13 pm Post subject: Posted: Fri Aug 28, 2009 5:13 pm Post subject: |
 |
|
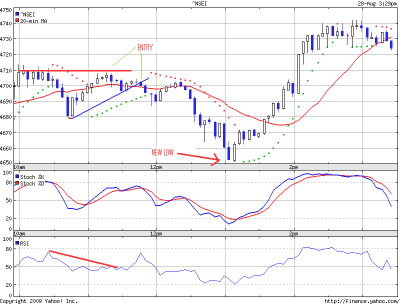
Hi,
Today, again NVK setup presented
Chart is posted below
Rest all self explanory.
SHEKHAR
| Description: |
|
| Filesize: |
11.96 KB |
| Viewed: |
950 Time(s) |
|
|
|
| Back to top |
|
 |
|
|
|
natarajmtech
White Belt

Joined: 13 Oct 2008
Posts: 61
|
| Post: #32 Posted: Mon Aug 31, 2009 11:58 am Post subject: Not met the criteria |
|
|
| shekharinvest wrote: | Hi,
Today, again NVK setup presented
Chart is posted below
Rest all self explanory.
SHEKHAR |
Hi Shekhar,
Sorry to tell you that your drawing on the graph not met the criteria of NVK setup posted by the Seikat originally. Say for example , he mentioned about double top or slighly higher high but here is the second top is lower than the previous high and more he mentioned about the intermediate trough should not be lower than the day's low and the chart violated that too.. Moreover the RSI is also not convincingly break out from overbought to oversold territory. If you had different interpretation of NVK setup please elaborate here
|
|
| Back to top |
|
|
shekharinvest
Yellow Belt
Joined: 21 Dec 2007
Posts: 549
|
| Post: #33 Posted: Mon Aug 31, 2009 4:07 pm Post subject: |
|
|
natarajmtech
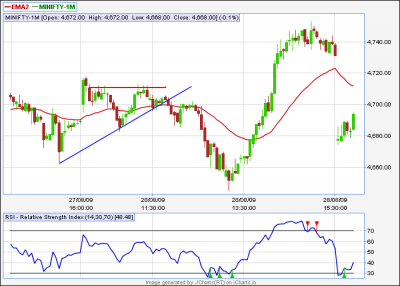
The second high may not be equal to the previous high but it is still quite close to the top 3 to 5 point may be ignored as we are seeing quite a huge divergence on the RSI, which might not start from the OB region though.
Posted below is the chart for NF where you can see a better double top (ignore the opening spikes) and the trendline from previous day which might give you a better perspective, although no divergence on RSI !!!
Saikat setup is based entirely on Yahoo Chart
TA is all subjective, I may be wrong that's how I went about the trade.
SHEKHAR
| Description: |
|
| Filesize: |
31.08 KB |
| Viewed: |
833 Time(s) |
|
|
|
| Back to top |
|
|
natarajmtech
White Belt
Joined: 13 Oct 2008
Posts: 61
|
| Post: #34 Posted: Tue Sep 01, 2009 2:10 pm Post subject: |
|
|
| shekharinvest wrote: | natarajmtech
The second high may not be equal to the previous high but it is still quite close to the top 3 to 5 point may be ignored as we are seeing quite a huge divergence on the RSI, which might not start from the OB region though.
Posted below is the chart for NF where you can see a better double top (ignore the opening spikes) and the trendline from previous day which might give you a better perspective, although no divergence on RSI !!!
Saikat setup is based entirely on Yahoo Chart
TA is all subjective, I may be wrong that's how I went about the trade.
SHEKHAR |
Hi Shekar,
Thanks for your reply.
Today (01 Sep 2009) the NVK setup rocked without any ambiguity and I have attached the file and please let me know if I am wrong anywhere in my interpretation. I am posting this at the mid of the market as this setup really happened as per Saikat rule.
| Description: |
|
| Filesize: |
14.22 KB |
| Viewed: |
879 Time(s) |
|
|
|
| Back to top |
|
|
shekharinvest
Yellow Belt
Joined: 21 Dec 2007
Posts: 549
|
| Post: #35 Posted: Tue Sep 01, 2009 6:58 pm Post subject: |
|
|
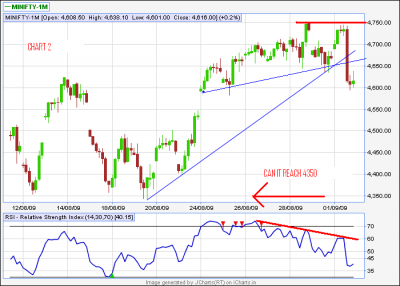
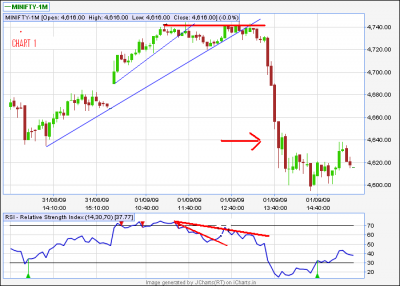
Hi,
Posted below are two charts
Chart one is intraday.
It offered two opportunities it failed on the first attempt.
But second time with TL starting from yesterdays low, it rocked.
I had to enjoy from the sidelines today could not enter on both the occasions. (Network problem)
Second Chart is Hourly starting from Aug 19 lows a similar setup can be seen trend line has been breached. For some one who plays positional shorts.
Will it reach 4350 ? I have not idea just an observation posted for future reference.
SHEKHAR
| Description: |
|
| Filesize: |
33.25 KB |
| Viewed: |
822 Time(s) |
|
| Description: |
|
| Filesize: |
29.67 KB |
| Viewed: |
802 Time(s) |
|
|
|
| Back to top |
|
|
saikat
White Belt
Joined: 31 Mar 2008
Posts: 317
|
| Post: #36 Posted: Tue Sep 01, 2009 11:52 pm Post subject: |
|
|
Hello,
Great to see that many people are noticing the set up and trading it.
I had made the chart for today to post but saw already two posted 
Shekhar - lets see how the hourly set up works 
Natarajmtech - you have spotted very accurately - no ambiguity
Cheers!!!!!
Saikat
|
|
| Back to top |
|
|
natarajmtech
White Belt
Joined: 13 Oct 2008
Posts: 61
|
| Post: #37 Posted: Wed Sep 02, 2009 12:10 pm Post subject: |
|
|
| saikat wrote: | Hello,
Great to see that many people are noticing the set up and trading it.
I had made the chart for today to post but saw already two posted
Shekhar - lets see how the hourly set up works
Natarajmtech - you have spotted very accurately - no ambiguity
Cheers!!!!!
Saikat |
Hi Saikat,
Thanks for your encouraging response and also sharing a valuable tips like NVK setup in a public forum. Looking forward more such insights from you. In mean time how I could draw a trend line in price and in other technical indicators such as RSI in yahoo RT chart. If it is not available with yahoo RT chart then how do you manage to draw such a line in a charts ? I imagine one possibility is to hit “screenprint” button of the yahoo RT chart and paste it into “mspaint” and draw a trend line but I do not think that this is a right method to do so. Please share that information that would be more useful for me since I rely on free charting tools like yahoo RT charts.
Regards,
Nataraj
|
|
| Back to top |
|
|
natarajmtech
White Belt
Joined: 13 Oct 2008
Posts: 61
|
| Post: #38 Posted: Wed Sep 02, 2009 1:44 pm Post subject: Today at mid of the day to Check NVK setup strike rate |
|
|
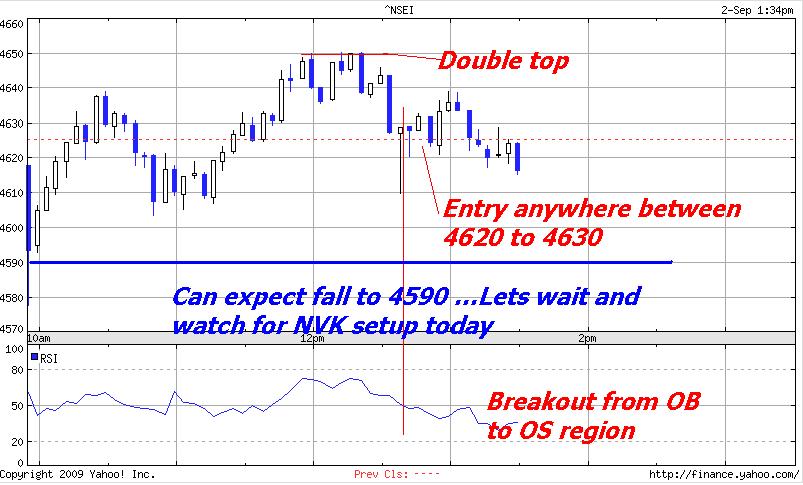
Hi everyone,
I have posted the NVK setup formation today 1:30PM and the target not met but waiting for what will happen today.
I have also posted my chart with prediction target marked on it.
Lets see what will happen today ?
At the time of this post NIFTY is trading at 4616.00 down 9 points from its previous day close.
Regards,
Nataraj
| Description: |
|
| Filesize: |
78.25 KB |
| Viewed: |
4809 Time(s) |
|
|
|
| Back to top |
|
|
natarajmtech
White Belt
Joined: 13 Oct 2008
Posts: 61
|
| Post: #39 Posted: Wed Sep 02, 2009 3:53 pm Post subject: Re: Today at mid of the day to Check NVK setup strike rate |
|
|
| natarajmtech wrote: | Hi everyone,
I have posted the NVK setup formation today 1:30PM and the target not met but waiting for what will happen today.
I have also posted my chart with prediction target marked on it.
Lets see what will happen today ?
At the time of this post NIFTY is trading at 4616.00 down 9 points from its previous day close.
Regards,
Nataraj |
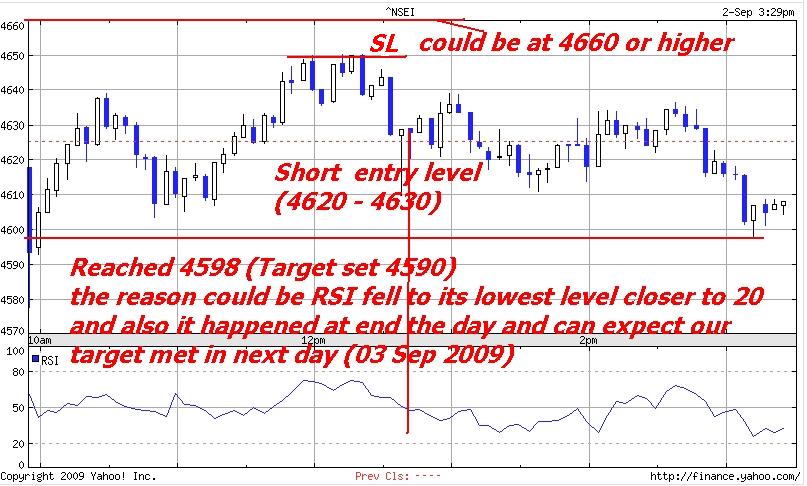
Hi everyone,
The set up rocked again today also, but the target not met and I have pointed out a reason for that in my attached chart for the entire day (02 Sep 2009). But overall there are some 20 points of nifty could have been gained out of this setup if followed the rule properly today. Lets see how consistent this setup is for the days to come. I am not trading the rule but I am just try to see whether this setup is happened just by a chance or we are outsmarting the market by sensing most of the traders’ psychology in the market from this pattern.
Regards,
Nataraj
| Description: |
|
| Filesize: |
91.81 KB |
| Viewed: |
4647 Time(s) |
|
|
|
| Back to top |
|
|
shekharinvest
Yellow Belt
Joined: 21 Dec 2007
Posts: 549
|
| Post: #40 Posted: Thu Sep 03, 2009 3:45 pm Post subject: |
|
|
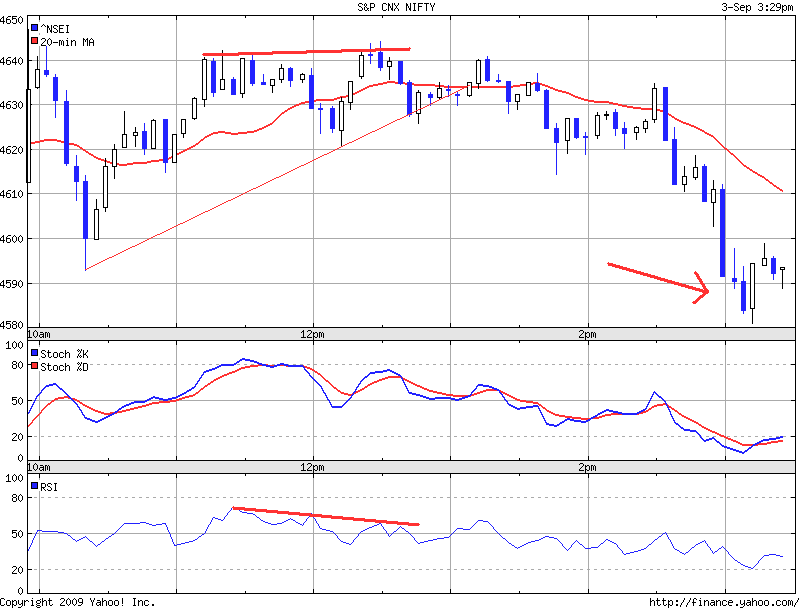
natarajmtech,
There is no divergence seen in the chart posted by you for Sept 02, 2009.
This is not the setup we are discussing about.
Please see todays chart posted below.
SHEKHAR
| Description: |
|
| Filesize: |
11.25 KB |
| Viewed: |
4571 Time(s) |
|
|
|
| Back to top |
|
|
natarajmtech
White Belt
Joined: 13 Oct 2008
Posts: 61
|
| Post: #41 Posted: Fri Sep 04, 2009 5:30 pm Post subject: |
|
|
| shekharinvest wrote: | natarajmtech,
There is no divergence seen in the chart posted by you for Sept 02, 2009.
This is not the setup we are discussing about.
Please see todays chart posted below.
SHEKHAR |
Hi Shekhar,
Thanks for your feedback and correcting me. Yes, I thought divergence is essentialy meant for breaking one terriotory to another. I did see the trendline drawn on the RSI chart posted by Saikat and you but I did not understand then, Now I understand it clearly. But shouldnt it called RSI trending low or high rather than positive or negative divergence ? Any way thank you again for your valuble feedback and today (04 Sep 2009) also I could see an oppertunity for a short in earlier of the day. Thanks for all your support.
|
|
| Back to top |
|
|
saikat
White Belt
Joined: 31 Mar 2008
Posts: 317
|
|
| Back to top |
|
|
natarajmtech
White Belt
Joined: 13 Oct 2008
Posts: 61
|
| Post: #43 Posted: Thu Sep 17, 2009 1:44 pm Post subject: |
|
|
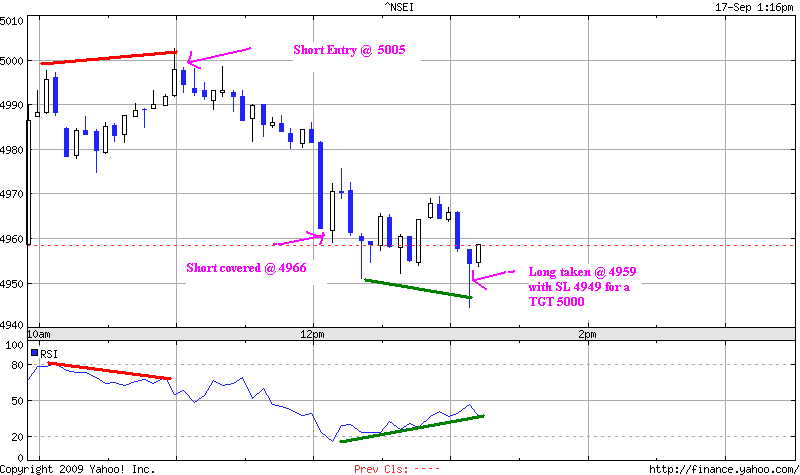
| saikat wrote: | Hello,
Why people stopped posting charts for this set up here? 
I hope you hvn't stopped trading the setup.... 
OK... some booster from me...
Posting todays chart as of 13: 15
One trade done - 2nd one holding
Cheers
"Don't be afraid to be weak
Don't be too proud to be strong
Just look into your heart, my friend
That will be the return to yourself
The return to innocence."
Saikat |
Hi Saikat,
Thanks for coming back . I am also spotted the Short and Long oppertunity today. Very clear NVK setup without any room for doubt. let see how the long today pan out to be. Looking for more strategy from you.
With regards,
Nataraj
|
|
| Back to top |
|
|
saikat
White Belt
Joined: 31 Mar 2008
Posts: 317
|
| Post: #44 Posted: Thu Sep 17, 2009 3:12 pm Post subject: |
|
|
Hello
15:05
NF hits 5000
2nd Trade limit sqr off order hit
2 Trades - 90 points
Cheers to NVS sir
Regards,
Saikat
| saikat wrote: | Hello,
Why people stopped posting charts for this set up here?
I hope you hvn't stopped trading the setup....
OK... some booster from me...
Posting todays chart as of 13: 15
One trade done - 2nd one holding
Cheers
"Don't be afraid to be weak
Don't be too proud to be strong
Just look into your heart, my friend
That will be the return to yourself
The return to innocence."
Saikat |
|
|
| Back to top |
|
|
shekharinvest
Yellow Belt
Joined: 21 Dec 2007
Posts: 549
|
| Post: #45 Posted: Thu Sep 17, 2009 4:04 pm Post subject: |
|
|
| saikat wrote: | Hello,
Why people stopped posting charts for this set up here?
I hope you hvn't stopped trading the setup....
OK... some booster from me...
Posting todays chart as of 13: 15
One trade done - 2nd one holding
Cheers
"Don't be afraid to be weak
Don't be too proud to be strong
Just look into your heart, my friend
That will be the return to yourself
The return to innocence."
Saikat |
SAIKAT
Welcome back.
Setup is being traded.
Hope people have grasped the setup, hence, not much interest is shown here.
You are requested to start a new thread with trading setup for swing trades, possibly with one of your favorite stocks/NF so that we can follow it on daily basis at EOD.
THANKS.
SHEKHAR
|
|
| Back to top |
|
|
|