| View previous topic :: View next topic |
| Author |
NVK SET UP |
mvnm
White Belt

Joined: 15 Aug 2008
Posts: 54
|
Post: #301  Posted: Wed Mar 10, 2010 10:50 am Post subject: Re: clarification by saiket Posted: Wed Mar 10, 2010 10:50 am Post subject: Re: clarification by saiket |
 |
|
thanks saiket for you clarification it would help me a lot.  
| saikat wrote: | | msrimahidar wrote: | saiket not clarified till now 
| msrimahidar wrote: | Dear saiket,
In SB you have said that Educomp is not a NVK set up.
I require some clarification on this aspect. You are referring to Class A divergence and Class B Divergence. After going though the thread from begenning i have been able to infer the following.
1. Class A Divergence - when Price has made a double bottom or top and RSI is making higher bottom or lower high
2.Class B Divergence - when Price has hade a lower low or Higher high and RSI has made Higher low and Lower high.
If the above is correct which one is better?
a i correct?
another clarification whether the positive or -ve divergence whould be made above the oversold line or and below the over bought line.
Please clarify the above.
i the case of Educomp you have said that it is not an NVK. i am herewith attaching the chart of EDUcomp and as per me it has formed NVK and also confirmed the same if not an NVK why it would held me in fine tuning my self in identification of the same.
Thanking you in Advance
M.Sri mahidar  |
|
Hello MSR,
Sorry for this late reply. I missed ur original post.
Pl ping me in SB if you want to discuss something.
Ok.... Yes that chart u posted was not NVK - it was CLASS A diveregence.
You have mixed up the A & B types
Here it is again
Class A Bullish Divergence:
Class A Bullish Divergences occurs only when prices makes a lower low but the oscillator makes a higher low.
This is the strongest buy signal.
Class B Bullish Divergence:
Class B Bullish Divergences occurs when price makes a double bottom and the oscillator makes a higher low.
This is what we trade here in this topic (NVK Setup).
This is the second strongest buy signal.
Class C Bullish Divergence:
Class C Bullish Divergences occurs when the indicator has made a double bottom
and the price makes a lower low.
Ok.. now which one is better? I trade CLASS B as I give more importance to horizontal support - simple. And I can honestly say that I have very good hit ratio. Even if the trade hits SL -it is usually very low.
You have to observe and decide.
I had posted one of my earlier trade in Educomp using NVK. Which I posted in this thread live during Entry. I will dig that chart for u and post again - for you to see - that was a very good trade.
Regards.
Saikat |
|
|
| Back to top |
|
 |
|
|
 |
saikat
White Belt

Joined: 31 Mar 2008
Posts: 317
|
Post: #302  Posted: Wed Mar 10, 2010 2:52 pm Post subject: Posted: Wed Mar 10, 2010 2:52 pm Post subject: |
 |
|
Hi,
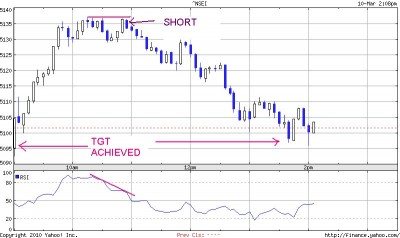
Today NVK on NS Yahoo chart absolutely rocked...
Very good looking set up.
Yesterday's Swing short today SL hit @ 5130 - but immediately after this setup formed - so shorted double quantity @ 5132
50% booked @ 5099.
Rest again would carry as Swing - now SL 5145.
Though my 34 hourly EMA not broken - but chart is looking very bad to me.
Lets see.....
Cheers!!!!!
Saikat
| Description: |
|
| Filesize: |
69.77 KB |
| Viewed: |
450 Time(s) |
|
|
|
| Back to top |
|
 |
kush
White Belt

Joined: 25 Nov 2009
Posts: 17
|
Post: #303  Posted: Wed Mar 10, 2010 6:16 pm Post subject: Posted: Wed Mar 10, 2010 6:16 pm Post subject: |
 |
|
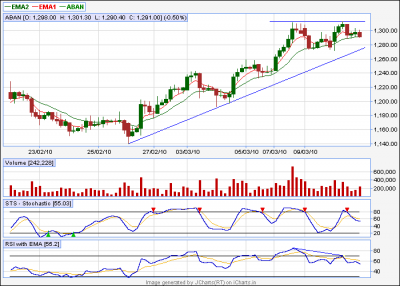
can u please confirm ?
" Aban" , 60 Min tf
Kush
| Description: |
|
| Filesize: |
14.94 KB |
| Viewed: |
439 Time(s) |
|
|
|
| Back to top |
|
 |
kush
White Belt

Joined: 25 Nov 2009
Posts: 17
|
Post: #304  Posted: Wed Mar 10, 2010 6:43 pm Post subject: Posted: Wed Mar 10, 2010 6:43 pm Post subject: |
 |
|
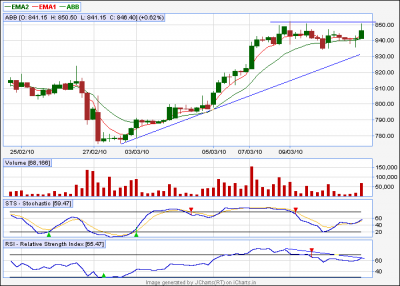
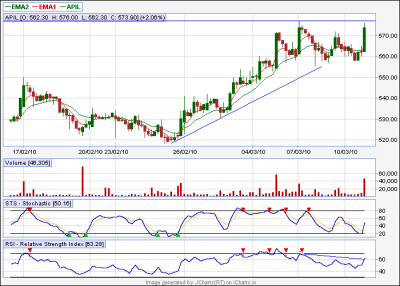
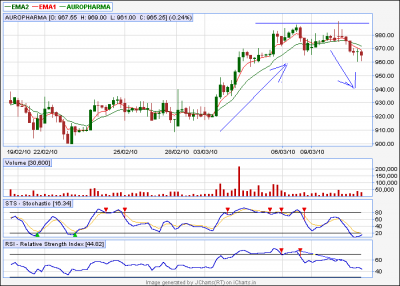
And these are ? tf 60 min for all
| Description: |
|
| Filesize: |
12.7 KB |
| Viewed: |
445 Time(s) |
|
| Description: |
|
| Filesize: |
14.61 KB |
| Viewed: |
431 Time(s) |
|
| Description: |
|
| Filesize: |
14.18 KB |
| Viewed: |
426 Time(s) |
|
|
|
| Back to top |
|
 |
saikat
White Belt

Joined: 31 Mar 2008
Posts: 317
|
Post: #305  Posted: Thu Mar 11, 2010 11:17 am Post subject: Posted: Thu Mar 11, 2010 11:17 am Post subject: |
 |
|
| kush wrote: | | And these are ? tf 60 min for all |
Hello Kush,
Yes.. all ur charts look pretty good as per NVK set up.
Best of luck.
Regards,
Saikat
|
|
| Back to top |
|
 |
saikat
White Belt

Joined: 31 Mar 2008
Posts: 317
|
Post: #306  Posted: Thu Mar 11, 2010 12:20 pm Post subject: Posted: Thu Mar 11, 2010 12:20 pm Post subject: |
 |
|
Hello,
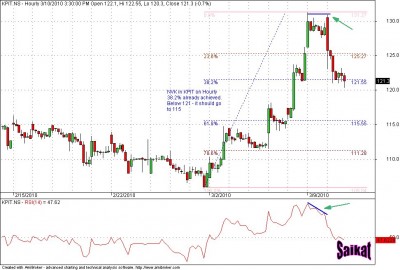
NVK on KPIT
Trade not taken
Only monitoring the behaviour.
The scrip looks good for swing trading - clean chart like Polaris.
Cheers!!!
Saikat
| Description: |
|
| Filesize: |
127.44 KB |
| Viewed: |
466 Time(s) |
|
|
|
| Back to top |
|
 |
rvg
White Belt

Joined: 31 Oct 2006
Posts: 279
|
Post: #307  Posted: Thu Mar 11, 2010 12:37 pm Post subject: KPIT Posted: Thu Mar 11, 2010 12:37 pm Post subject: KPIT |
 |
|
| KPIT usually gives 10-15% moves when it is in momentum.. its good to accumulate when it is silent.
|
|
| Back to top |
|
 |
vinst
Black Belt

Joined: 09 Jan 2007
Posts: 3303
|
Post: #308  Posted: Thu Mar 11, 2010 12:48 pm Post subject: Posted: Thu Mar 11, 2010 12:48 pm Post subject: |
 |
|
looks like we have to wait for 'that' one day in PATNI scrip to make gains.
vin
|
|
| Back to top |
|
 |
kanna
White Belt

Joined: 03 Jan 2010
Posts: 91
|
Post: #309  Posted: Thu Mar 11, 2010 1:17 pm Post subject: on KPIT chart, to Saikat sir Posted: Thu Mar 11, 2010 1:17 pm Post subject: on KPIT chart, to Saikat sir |
 |
|
sir,
in the KPIT chart u have posted, i have a small doubt. pls clarify. In the chart the set up is between 9/3/10 9to10 candle, and 10/3/10 9to10 candle. even though the high of both the candles are as per NVK, i feel we have to see the closing price for checking the setup. because on the first the close is 129.85 and the second close is 125.80. when the price is down , the RSI also comes down.
If suppose the second is also a green candle, with close near 129/130 and RSI is down, then it is a divergence. here it is not the case.
Am I missing something here. pls clarify. (But anyway, it is in profit now  ) )
rgds
vijay
|
|
| Back to top |
|
 |
kanna
White Belt

Joined: 03 Jan 2010
Posts: 91
|
Post: #310  Posted: Thu Mar 11, 2010 2:59 pm Post subject: Posted: Thu Mar 11, 2010 2:59 pm Post subject: |
 |
|
should we have this in mind when we are trading with oscillators like RSI . i read this in a forum, and copy and paste here. dont know whether i can put the link here?
How to trade with an oscillator
--------------------------------------------------------------------------------
I would like to share an important phenomenon regarding oscillator overbought/oversold conditions. Whenever an oscillator like Stochastics,( or even RSI,ROC etc ) stays above the overbought limit for more than 5 bars without taking a dip from overbought to neutral zone....the market has a lot of steam left further to go up, market then continues upward journey,then comes down,then goes into overbought zone again but shows negative divergence and then only it comes down...till then it keeps making higher tops. This is a very strong bullish signal to trade.....
Mirror image for oscillator staying in oversold region for more than 5 bars...
The above phenomenon was what was happening towards the later part of the session (26-06-09)....
|
|
| Back to top |
|
 |
saikat
White Belt

Joined: 31 Mar 2008
Posts: 317
|
|
| Back to top |
|
 |
saikat
White Belt

Joined: 31 Mar 2008
Posts: 317
|
Post: #312  Posted: Thu Mar 11, 2010 9:05 pm Post subject: Re: on KPIT chart, to Saikat sir Posted: Thu Mar 11, 2010 9:05 pm Post subject: Re: on KPIT chart, to Saikat sir |
 |
|
| kanna wrote: | sir,
in the KPIT chart u have posted, i have a small doubt. pls clarify. In the chart the set up is between 9/3/10 9to10 candle, and 10/3/10 9to10 candle. even though the high of both the candles are as per NVK, i feel we have to see the closing price for checking the setup. because on the first the close is 129.85 and the second close is 125.80. when the price is down , the RSI also comes down.
If suppose the second is also a green candle, with close near 129/130 and RSI is down, then it is a divergence. here it is not the case.
Am I missing something here. pls clarify. (But anyway, it is in profit now  ) )
rgds
vijay |
Hello Vijay,
Here what you have written is almost true but not fully true 
1. RSI is always calculated with closing price.
2. One candle close only has to be seen with respect of last candle close - to see whether the 'gain' is plus or minus.
3. The last candle is only having 1/14 th weightage - so it is not true that only as that last candle was a red - the RSI was down - yes... if the last candle is RED - then its RSI will be lower than the RSI of the previous candle - but here we are comparing it with RSI of 7 candle back one. So your confusion is not valid.
4. for example - here even if the last candle (10/3/10 9to10 am one) was to be marginally green - the RSI would have been lower than the RSI of 9/3/10 9to10 candle ( the one with which it has made the divergence).
I am not sure whether I am able to articulate properly... but just sit with the formula of RSI for a while - I think you will be clear.
Regards,
Saikat
|
|
| Back to top |
|
 |
saikat
White Belt

Joined: 31 Mar 2008
Posts: 317
|
Post: #313  Posted: Thu Mar 11, 2010 9:16 pm Post subject: Posted: Thu Mar 11, 2010 9:16 pm Post subject: |
 |
|
| kanna wrote: | should we have this in mind when we are trading with oscillators like RSI . i read this in a forum, and copy and paste here. dont know whether i can put the link here?
How to trade with an oscillator
--------------------------------------------------------------------------------
I would like to share an important phenomenon regarding oscillator overbought/oversold conditions. Whenever an oscillator like Stochastics,( or even RSI,ROC etc ) stays above the overbought limit for more than 5 bars without taking a dip from overbought to neutral zone....the market has a lot of steam left further to go up, market then continues upward journey,then comes down,then goes into overbought zone again but shows negative divergence and then only it comes down...till then it keeps making higher tops. This is a very strong bullish signal to trade.....
Mirror image for oscillator staying in oversold region for more than 5 bars...
The above phenomenon was what was happening towards the later part of the session (26-06-09).... |
Hello
You can find many different combination of behaviour if you see any TA tool - that's why it's difficult to make money  Isn't it? Isn't it?
The statement above is generally true but u surely also will find many cases where it has behaved differently.
Don't try to find a rule which works 100% time - there is none so.
Regards,
Saikat
|
|
| Back to top |
|
 |
Ravi_S
Yellow Belt

Joined: 15 Jun 2009
Posts: 569
|
Post: #314  Posted: Thu Mar 11, 2010 11:08 pm Post subject: Infy - NVK Posted: Thu Mar 11, 2010 11:08 pm Post subject: Infy - NVK |
 |
|
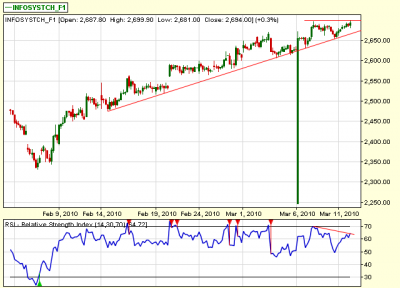
NVK setup in Infosys 60 mins TF... Let's see what happens... Targets can be 2612 and 2558...
| Description: |
|
| Filesize: |
19.69 KB |
| Viewed: |
453 Time(s) |
|
|
|
| Back to top |
|
 |
rvg
White Belt

Joined: 31 Oct 2006
Posts: 279
|
Post: #315  Posted: Thu Mar 11, 2010 11:40 pm Post subject: NVK in Renuka EoD Posted: Thu Mar 11, 2010 11:40 pm Post subject: NVK in Renuka EoD |
 |
|
| Saikat - Can you check EoD charts of Renuka also.. today an NVK Setup has formed similar to Bajaj Hindustan
|
|
| Back to top |
|
 |
|

