|
|
| View previous topic :: View next topic |
| Author |
NVK SET UP |
Ravi_S
Yellow Belt

Joined: 15 Jun 2009
Posts: 569
|
Post: #391  Posted: Thu Apr 01, 2010 8:37 pm Post subject: NVK - Bajaj Hindustan Posted: Thu Apr 01, 2010 8:37 pm Post subject: NVK - Bajaj Hindustan |
 |
|
Hi Shekar
Thanks for the response for my thread... I'm long in Bajajhind now an hopefully should come out once it reaches todays low (You know I keep strict Stop Losses these days). Also Could you please explain the RSI funda you posted below... Not clear to me...
Thanks in advance... 
Regards
Ravi
| shekharinvest wrote: | Sandew Hi,
Sorry for late response, I genreally do not look into personal messages.
Yes, the NVK setup is valid for all time frames and equally effective, It so happened that Saikat was doing it on the basis of Yahoo Charts, with it's default setting, and I too like the setup there very much, so our earlier discussion is based on that only.
"the peak should not be days high " is based on Yahoo charts for Intraday setups.
Alternatively, you can take the help of RSI, as in the chart posted by Ravi, Bajajhind has made double bottom and RSI has made a higer corresponding low, but have a look at RSI when price in between has made a peak RSI has risen above 50 and then came down to make a higher low. This negates the NVK setup.
Hence the NVK formed by Bajajhind is not tradeable. Although, price might go on to make high from here but I would not take the trade as per NVK setup.
Hope it clarifies
SHEKHAR |
|
|
| Back to top |
|
 |
|
|  |
shekharinvest
Yellow Belt

Joined: 21 Dec 2007
Posts: 549
|
Post: #392  Posted: Sat Apr 03, 2010 10:44 am Post subject: Re: NVK - Bajaj Hindustan Posted: Sat Apr 03, 2010 10:44 am Post subject: Re: NVK - Bajaj Hindustan |
 |
|
Ravi,
That response was specific to Sandew's query. Which, I somehow was unable to quote here.
There is nothing to explain about RSI as such. If you have some specific query you may please post.
The simple interpretetaion of RSI is once it crosess 50 from below its BUY and similary if it crosses 50 from above it SELL signal, therefore, as the NVK Setup is based on RSI - in your chart of bajajhind RSI has come down from above 50 hence giving a SELL, we have a contradicotry signal hence better to avoid.
Hence for NVK/divergence to be effective look for the same which are formed with the RSI remain below 45-50 range.
SHEKHAR
| Ravi_S wrote: | Hi Shekar
Thanks for the response for my thread... I'm long in Bajajhind now an hopefully should come out once it reaches todays low (You know I keep strict Stop Losses these days). Also Could you please explain the RSI funda you posted below... Not clear to me...
Thanks in advance... 
Regards
Ravi
| shekharinvest wrote: | Sandew Hi,
Sorry for late response, I genreally do not look into personal messages.
Yes, the NVK setup is valid for all time frames and equally effective, It so happened that Saikat was doing it on the basis of Yahoo Charts, with it's default setting, and I too like the setup there very much, so our earlier discussion is based on that only.
"the peak should not be days high " is based on Yahoo charts for Intraday setups.
Alternatively, you can take the help of RSI, as in the chart posted by Ravi, Bajajhind has made double bottom and RSI has made a higer corresponding low, but have a look at RSI when price in between has made a peak RSI has risen above 50 and then came down to make a higher low. This negates the NVK setup.
Hence the NVK formed by Bajajhind is not tradeable. Although, price might go on to make high from here but I would not take the trade as per NVK setup.
Hope it clarifies
SHEKHAR |
|
|
|
| Back to top |
|
 |
raghavacc
White Belt

Joined: 29 Aug 2009
Posts: 3
|
Post: #393  Posted: Sat Apr 03, 2010 1:38 pm Post subject: Posted: Sat Apr 03, 2010 1:38 pm Post subject: |
 |
|
Hi Saikat,
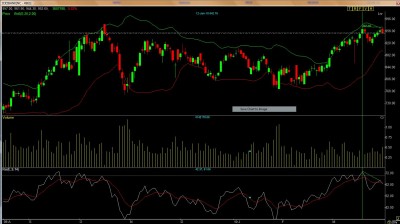
ICICI Bank daily charts.Great setup for shorting.
My analysis in line with NVK setup.
980 Rs. was previous high made in November which means now its at significant resistance level.
The second peak of the double top has great volume indicating selling pressure.
Top Bollinger band has touched the last 2 candles.
Then most importantly as per NVK setup double top negetive divergence.
Can you pls explain me how do i calculate my down target?
Regards
Raghav
| Description: |
|
| Filesize: |
161.52 KB |
| Viewed: |
512 Time(s) |

|
|
|
| Back to top |
|
 |
raghavacc
White Belt

Joined: 29 Aug 2009
Posts: 3
|
Post: #394  Posted: Sat Apr 03, 2010 1:42 pm Post subject: Posted: Sat Apr 03, 2010 1:42 pm Post subject: |
 |
|
Hi Saikat,
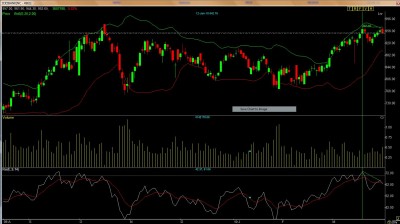
ICICI Bank daily charts.Great setup for shorting.
My analysis in line with NVK setup.
980 Rs. was previous high made in November which means now its at significant resistance level.
The second peak of the double top has great volume indicating selling pressure.
Top Bollinger band has touched the last 2 candles.
Then most importantly as per NVK setup double top negetive divergence.
Can you pls explain me how do i calculate my down target?
Regards
Raghav
| Description: |
|
| Filesize: |
161.52 KB |
| Viewed: |
502 Time(s) |

|
|
|
| Back to top |
|
 |
jjm
White Belt

Joined: 17 Mar 2010
Posts: 411
|
Post: #395  Posted: Sat Apr 03, 2010 7:47 pm Post subject: NVK even if RSI is more than 50 Posted: Sat Apr 03, 2010 7:47 pm Post subject: NVK even if RSI is more than 50 |
 |
|
Dear Shekhar,
Hi!
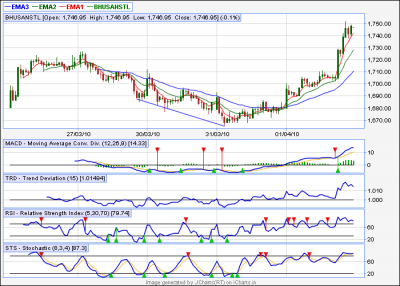
I am following the thread for Bhind as u siad if the RSI in between is more than 50 then it not valid for 100% NVK, however I paper traded in bushan steel but it worked. Of course it happen earlier than your post.
Expecting your valued comments on same.
Regards,
JJM
| Description: |
|
| Filesize: |
36.51 KB |
| Viewed: |
501 Time(s) |

|
|
|
| Back to top |
|
 |
sandew
White Belt

Joined: 02 Feb 2009
Posts: 174
|
Post: #396  Posted: Sun Apr 04, 2010 11:49 am Post subject: Posted: Sun Apr 04, 2010 11:49 am Post subject: |
 |
|
Bhushan Steel chart by JJM,
Is it the RSI deviation which did the trick OR was there a breakout above 1690 gettting confirmation via macd and trd. I feel it is the latter and rsi seems to be getting unfair credit here.
|
|
| Back to top |
|
 |
jjm
White Belt

Joined: 17 Mar 2010
Posts: 411
|
Post: #397  Posted: Sun Apr 04, 2010 2:09 pm Post subject: NVK Bhushan Steel Posted: Sun Apr 04, 2010 2:09 pm Post subject: NVK Bhushan Steel |
 |
|
Dear Sandew,
This is with context to RSI. If it is above 50 then it negates the NVK setup. But in case of said, it didn't. So the pt is whether we shld consider other oscillators to confirm the set up or to relay only on RSI for confirmation of NVK setup.
Regards,
JJM
|
|
| Back to top |
|
 |
shekharinvest
Yellow Belt

Joined: 21 Dec 2007
Posts: 549
|
Post: #398  Posted: Sun Apr 04, 2010 2:28 pm Post subject: Re: NVK even if RSI is more than 50 Posted: Sun Apr 04, 2010 2:28 pm Post subject: Re: NVK even if RSI is more than 50 |
 |
|
| jjm wrote: | Dear Shekhar,
Hi!
I am following the thread for Bhind as u siad if the RSI in between is more than 50 then it not valid for 100% NVK, however I paper traded in bushan steel but it worked. Of course it happen earlier than your post.
Expecting your valued comments on same.
Regards,
JJM |
JJM,
The chart posted by you in not as per NVK setup.
And the RSI used by you is for 5 periods, use default values for RSI.
Now if you see the same chart with default values you will notice that RSI has formed a double bottom and Price is making new lows which is Class C divergence, the weekest form but still may give you the results as in this case.
SHEKHAR.
|
|
| Back to top |
|
 |
shekharinvest
Yellow Belt

Joined: 21 Dec 2007
Posts: 549
|
|
| Back to top |
|
 |
saikat
White Belt

Joined: 31 Mar 2008
Posts: 317
|
Post: #400  Posted: Sun Apr 04, 2010 4:24 pm Post subject: Posted: Sun Apr 04, 2010 4:24 pm Post subject: |
 |
|
| raghavacc wrote: | Hi Saikat,
ICICI Bank daily charts.Great setup for shorting.
My analysis in line with NVK setup.
980 Rs. was previous high made in November which means now its at significant resistance level.
The second peak of the double top has great volume indicating selling pressure.
Top Bollinger band has touched the last 2 candles.
Then most importantly as per NVK setup double top negetive divergence.
Can you pls explain me how do i calculate my down target?
Regards
Raghav |
Hello,
As you might have noticed - I use FIBO of last visible swing to calculate targets. It is just my method - you can try this or think upon something better. Many times I do use 13/34 EMA of higher TF also as TGT.
Regards,
Saikat
|
|
| Back to top |
|
 |
saikat
White Belt

Joined: 31 Mar 2008
Posts: 317
|
Post: #401  Posted: Sun Apr 04, 2010 4:40 pm Post subject: Re: NVK - Bajaj Hindustan Posted: Sun Apr 04, 2010 4:40 pm Post subject: Re: NVK - Bajaj Hindustan |
 |
|
Hi Shekhar,
Thanks a lot for assisting others on this thread.
You have got the idea of RSI very correctly... the reason is simple actually.  isn't it? isn't it?
And a general request to all posting chart here......
As it is all about a specific Set up - it will be better if you remove other TA tools (like MACD / STS etc.. ) from the chart - before posting.
The setup will look nicer then and will be more visible.
Few charts are with even 4  indicators? indicators?
How one can trade with 4 indicators? There will be confusion always..... 
Regards,
Saikat
| shekharinvest wrote: | Ravi,
That response was specific to Sandew's query. Which, I somehow was unable to quote here.
There is nothing to explain about RSI as such. If you have some specific query you may please post.
The simple interpretetaion of RSI is once it crosess 50 from below its BUY and similary if it crosses 50 from above it SELL signal, therefore, as the NVK Setup is based on RSI - in your chart of bajajhind RSI has come down from above 50 hence giving a SELL, we have a contradicotry signal hence better to avoid.
Hence for NVK/divergence to be effective look for the same which are formed with the RSI remain below 45-50 range.
SHEKHAR
| Ravi_S wrote: | Hi Shekar
Thanks for the response for my thread... I'm long in Bajajhind now an hopefully should come out once it reaches todays low (You know I keep strict Stop Losses these days). Also Could you please explain the RSI funda you posted below... Not clear to me...
Thanks in advance... 
Regards
Ravi
| shekharinvest wrote: | Sandew Hi,
Sorry for late response, I genreally do not look into personal messages.
Yes, the NVK setup is valid for all time frames and equally effective, It so happened that Saikat was doing it on the basis of Yahoo Charts, with it's default setting, and I too like the setup there very much, so our earlier discussion is based on that only.
"the peak should not be days high " is based on Yahoo charts for Intraday setups.
Alternatively, you can take the help of RSI, as in the chart posted by Ravi, Bajajhind has made double bottom and RSI has made a higer corresponding low, but have a look at RSI when price in between has made a peak RSI has risen above 50 and then came down to make a higher low. This negates the NVK setup.
Hence the NVK formed by Bajajhind is not tradeable. Although, price might go on to make high from here but I would not take the trade as per NVK setup.
Hope it clarifies
SHEKHAR |
|
|
|
|
| Back to top |
|
 |
sandew
White Belt

Joined: 02 Feb 2009
Posts: 174
|
Post: #402  Posted: Sun Apr 04, 2010 8:42 pm Post subject: Time Frame Posted: Sun Apr 04, 2010 8:42 pm Post subject: Time Frame |
 |
|
| May I add, Please do always write the TIME FRAME the chart posted is, daily, 60 min, 15 min, 5 min, etc.. this saves time determining.
|
|
| Back to top |
|
 |
Ravi_S
Yellow Belt

Joined: 15 Jun 2009
Posts: 569
|
|
| Back to top |
|
 |
Ravi_S
Yellow Belt

Joined: 15 Jun 2009
Posts: 569
|
Post: #404  Posted: Mon Apr 05, 2010 1:41 pm Post subject: BajajHind - NVK Posted: Mon Apr 05, 2010 1:41 pm Post subject: BajajHind - NVK |
 |
|
Bajaj Hind Rocking.... 
|
|
| Back to top |
|
 |
rvg
White Belt

Joined: 31 Oct 2006
Posts: 279
|
Post: #405  Posted: Mon Apr 05, 2010 5:35 pm Post subject: DhampurSug Hourly Posted: Mon Apr 05, 2010 5:35 pm Post subject: DhampurSug Hourly |
 |
|
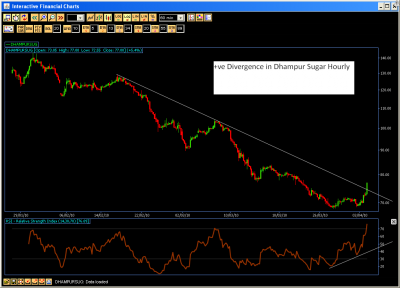
Dhampur Sugar Hourly
| Description: |
|
| Filesize: |
55.64 KB |
| Viewed: |
426 Time(s) |

|
|
|
| Back to top |
|
 |
|
|
You cannot post new topics in this forum
You cannot reply to topics in this forum
You cannot edit your posts in this forum
You cannot delete your posts in this forum
You cannot vote in polls in this forum
You can attach files in this forum
You can download files in this forum
|
Powered by phpBB © 2001, 2005 phpBB Group
|
|
|

