| View previous topic :: View next topic |
| Author |
NVK SET UP |
raghavacc
White Belt

Joined: 29 Aug 2009
Posts: 3
|
Post: #406  Posted: Mon Apr 05, 2010 6:07 pm Post subject: Posted: Mon Apr 05, 2010 6:07 pm Post subject: |
 |
|
| saikat wrote: | Hello,
Today NVK worked very beautifully - the set up was quite good looking.
As I was not in SB that time - I couldn't shout 
But I hope it was too easy to notice and trade.
As I was already swing short since yesterday in April @ 5307
so I took intra long in May and as I was to go out for some time I had kept
a limit Sqr off order 5 points below morning high - which got hit after just 7 candles - thanks to 20 odd points premium in May that time 
That's why though on NS chart the high it made after trade entry doesn't look like anywhere near morning high - but the MAY future almost reached morning high.
Cheers !!!!!!!
Saikat |
Hello Saikat,
A novice type of question. Hope you wont mind.
The chart you have been attaching like one above are crystal clear.But in Finance.yahoo.com when I open interactive charts display of charts is somewhat differnt? Can you pls guide me how to customise the settings to make it appear like the one above?
Regards
Raghav
|
|
| Back to top |
|
 |
|
|
 |
vinst
Black Belt

Joined: 09 Jan 2007
Posts: 3303
|
Post: #407  Posted: Mon Apr 05, 2010 10:42 pm Post subject: Posted: Mon Apr 05, 2010 10:42 pm Post subject: |
 |
|
RV,
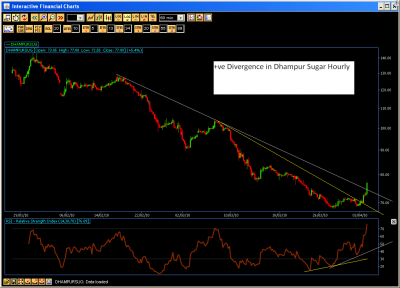
Could dhampur have been traded as shown with yellow line? Is it a weaker +ve divergence?
regards
vin
| Description: |
|
| Filesize: |
56.12 KB |
| Viewed: |
443 Time(s) |

|
|
|
| Back to top |
|
 |
rvg
White Belt

Joined: 31 Oct 2006
Posts: 279
|
Post: #408  Posted: Mon Apr 05, 2010 11:12 pm Post subject: Dhampur Sugars Posted: Mon Apr 05, 2010 11:12 pm Post subject: Dhampur Sugars |
 |
|
| vinst wrote: | RV,
Could dhampur have been traded as shown with yellow line? Is it a weaker +ve divergence?
regards
vin |
Yes.. But Sugars have been giving false signals in past... also the chart attached is incomplete as the adjusted close is actually below the TL.
|
|
| Back to top |
|
 |
Ravi_S
Yellow Belt

Joined: 15 Jun 2009
Posts: 569
|
|
| Back to top |
|
 |
Ravi_S
Yellow Belt

Joined: 15 Jun 2009
Posts: 569
|
Post: #410  Posted: Tue Apr 06, 2010 10:30 am Post subject: Posted: Tue Apr 06, 2010 10:30 am Post subject: |
 |
|
SL Triggered...   
|
|
| Back to top |
|
 |
kanna
White Belt

Joined: 03 Jan 2010
Posts: 91
|
Post: #411  Posted: Tue Apr 06, 2010 1:48 pm Post subject: HPCL NVK in daily Posted: Tue Apr 06, 2010 1:48 pm Post subject: HPCL NVK in daily |
 |
|
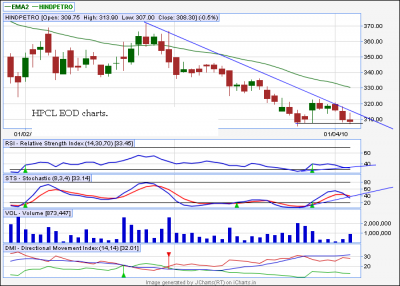
Does it look like an NVK . Hind Petro Daily charts
| Description: |
|
| Filesize: |
39.86 KB |
| Viewed: |
438 Time(s) |

|
|
|
| Back to top |
|
 |
shekharinvest
Yellow Belt

Joined: 21 Dec 2007
Posts: 549
|
Post: #412  Posted: Tue Apr 06, 2010 7:30 pm Post subject: Posted: Tue Apr 06, 2010 7:30 pm Post subject: |
 |
|
Hi,
Ravi & Kanna you both are trying to predict the NVK setup formation.
No trade can be taken on assumptions.
Wait for the confirmation to initiate the trade.
Confirmation could be the next green candle after a double bottom, or a hammer formation with long tail, or it could be a buy signal given by STS as I use.
SHEKHAR
|
|
| Back to top |
|
 |
rhtbaweja
White Belt

Joined: 19 Jan 2010
Posts: 30
|
Post: #413  Posted: Tue Apr 06, 2010 8:02 pm Post subject: Posted: Tue Apr 06, 2010 8:02 pm Post subject: |
 |
|
| i m newone ,please tell me what is the nvk setup formation
|
|
| Back to top |
|
 |
vinst
Black Belt

Joined: 09 Jan 2007
Posts: 3303
|
Post: #414  Posted: Tue Apr 06, 2010 9:42 pm Post subject: Posted: Tue Apr 06, 2010 9:42 pm Post subject: |
 |
|
rhtbaweja,
please go trough first few pages of this thread. NVK setup will be clear, more or less.
regards
vin
|
|
| Back to top |
|
 |
Ravi_S
Yellow Belt

Joined: 15 Jun 2009
Posts: 569
|
Post: #415  Posted: Tue Apr 06, 2010 11:06 pm Post subject: Posted: Tue Apr 06, 2010 11:06 pm Post subject: |
 |
|
Shekar
In today's trade, the confirmation was got after the 1st candle which was a RED hanging man. So there was nothing wrong in initiating this trade ain't it?
Regards
Ravi
| shekharinvest wrote: | Hi,
Ravi & Kanna you both are trying to predict the NVK setup formation.
No trade can be taken on assumptions.
Wait for the confirmation to initiate the trade.
Confirmation could be the next green candle after a double bottom, or a hammer formation with long tail, or it could be a buy signal given by STS as I use.
SHEKHAR |
|
|
| Back to top |
|
 |
Ravi_S
Yellow Belt

Joined: 15 Jun 2009
Posts: 569
|
|
| Back to top |
|
 |
shekharinvest
Yellow Belt

Joined: 21 Dec 2007
Posts: 549
|
|
| Back to top |
|
 |
saikat
White Belt

Joined: 31 Mar 2008
Posts: 317
|
Post: #418  Posted: Thu Apr 08, 2010 10:19 pm Post subject: Posted: Thu Apr 08, 2010 10:19 pm Post subject: |
 |
|
Hello all,
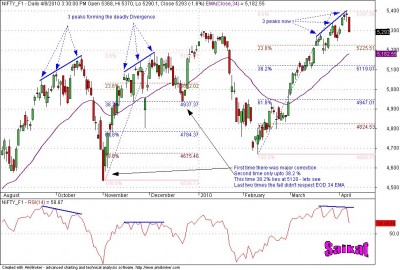
My EOD NF view.
No NVK here - but thought to post here in this thread only so that I can easily monitor and discuss.
5479 is 78.6% of the big fall.
And 1-2% error in that big FIBO range is quite normal
5398 is within 2% of 5479. So a big correction may come.
Lets see......
Hold onto shorts and watch
Cheers !!!
| Description: |
|
| Filesize: |
165.35 KB |
| Viewed: |
744 Time(s) |

|
|
|
| Back to top |
|
 |
girishhu1
White Belt

Joined: 17 Aug 2009
Posts: 316
|
Post: #419  Posted: Sat Apr 10, 2010 4:38 am Post subject: Posted: Sat Apr 10, 2010 4:38 am Post subject: |
 |
|
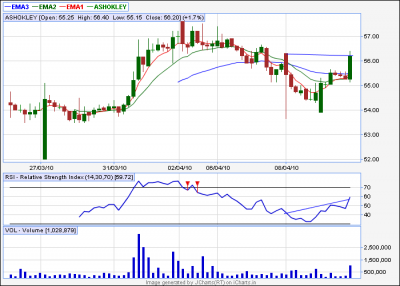
pl confirm nvk setup in ashok leyland
| Description: |
|
| Filesize: |
20.29 KB |
| Viewed: |
440 Time(s) |

|
|
|
| Back to top |
|
 |
Ravi_S
Yellow Belt

Joined: 15 Jun 2009
Posts: 569
|
Post: #420  Posted: Sat Apr 10, 2010 10:11 am Post subject: Posted: Sat Apr 10, 2010 10:11 am Post subject: |
 |
|
hI
This is not an NVK in Ashok Leyland... For NVK there should have been a double top or double bottom that should have been formed. Morover for double top the RSI should be decreasing and not increasing. Also the RSI shoiuld be in the overbought/oversold zone to give good results.
Hope this is clear..
Regards
Ravi  [/img] [/img]
|
|
| Back to top |
|
 |
|

