| View previous topic :: View next topic |
| Author |
NVK SET UP |
ashis
White Belt

Joined: 28 Mar 2010
Posts: 75
|
Post: #421  Posted: Sun Apr 11, 2010 7:17 am Post subject: Posted: Sun Apr 11, 2010 7:17 am Post subject: |
 |
|
Dear sir
Can you guide me for perfact FIBO range ?
I found it was 23%, 38.2%, 50%, 61.8%, 75% ,85%, 100% and 200%
Is it right?
Also guide me this calculation is bases on what? previous high and low or anything else?
Regards
Ashis
| saikat wrote: | Hello all,
My EOD NF view.
No NVK here - but thought to post here in this thread only so that I can easily monitor and discuss.
5479 is 78.6% of the big fall.
And 1-2% error in that big FIBO range is quite normal
5398 is within 2% of 5479. So a big correction may come.
Lets see......
Hold onto shorts and watch
Cheers !!! |
|
|
| Back to top |
|
 |
|
|
 |
saikat
White Belt

Joined: 31 Mar 2008
Posts: 317
|
Post: #422  Posted: Sun Apr 11, 2010 11:16 am Post subject: Posted: Sun Apr 11, 2010 11:16 am Post subject: |
 |
|
Hello Ashis,
The FIBO ratios mostly used in mkt are 23.6 / 38.2 / 61.8 / 78.6 / 100 / 127.2 / 161.8
These are derived from the FIBO series. 0 1 1 2 3 5 8 13 21 34 ........
You try different ratios and their sqr roots or sqr - U will find them pretty easily.
For FIBO retracements - You take last swing high/low and calculate.
You can find many charts posted in this thread having FIBO retracements marked on them. Observe them - you should get the idea.
Regards,
Saikat
| ashis wrote: | Dear sir
Can you guide me for perfact FIBO range ?
I found it was 23%, 38.2%, 50%, 61.8%, 75% ,85%, 100% and 200%
Is it right?
Also guide me this calculation is bases on what? previous high and low or anything else?
Regards
Ashis
| saikat wrote: | Hello all,
My EOD NF view.
No NVK here - but thought to post here in this thread only so that I can easily monitor and discuss.
5479 is 78.6% of the big fall.
And 1-2% error in that big FIBO range is quite normal
5398 is within 2% of 5479. So a big correction may come.
Lets see......
Hold onto shorts and watch
Cheers !!! |
|
|
|
| Back to top |
|
 |
Kamalesh
White Belt

Joined: 20 Sep 2008
Posts: 4
|
Post: #423  Posted: Sat Apr 17, 2010 1:49 pm Post subject: Posted: Sat Apr 17, 2010 1:49 pm Post subject: |
 |
|
| saikat wrote: | Hello Ashis,
The FIBO ratios mostly used in mkt are 23.6 / 38.2 / 61.8 / 78.6 / 100 / 127.2 / 161.8    
These are derived from the FIBO series. 0 1 1 2 3 5 8 13 21 34 ........
You try different ratios and their sqr roots or sqr - U will find them pretty easily.
For FIBO retracements - You take last swing high/low and calculate.
You can find many charts posted in this thread having FIBO retracements marked on them. Observe them - you should get the idea.
Regards,
Saikat
| ashis wrote: | Dear sir
Can you guide me for perfact FIBO range ?
I found it was 23%, 38.2%, 50%, 61.8%, 75% ,85%, 100% and 200%
Is it right?
Also guide me this calculation is bases on what? previous high and low or anything else?
Regards
Ashis
| saikat wrote: | Hello all,
My EOD NF view.
No NVK here - but thought to post here in this thread only so that I can easily monitor and discuss.
5479 is 78.6% of the big fall.
And 1-2% error in that big FIBO range is quite normal
5398 is within 2% of 5479. So a big correction may come.
Lets see......
Hold onto shorts and watch
Cheers !!! |
|
|
|
|
| Back to top |
|
 |
mvnm
White Belt

Joined: 15 Aug 2008
Posts: 54
|
Post: #424  Posted: Mon Apr 19, 2010 12:18 pm Post subject: nkv in Unitech Posted: Mon Apr 19, 2010 12:18 pm Post subject: nkv in Unitech |
 |
|
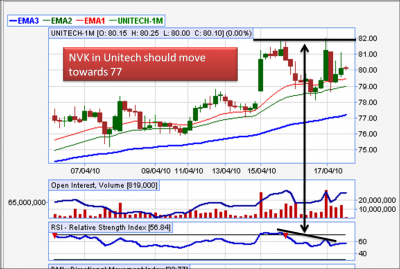
NVK in unitech
M.Sri Mahidar
| Description: |
|
| Filesize: |
312.92 KB |
| Viewed: |
463 Time(s) |

|
|
|
| Back to top |
|
 |
ashis
White Belt

Joined: 28 Mar 2010
Posts: 75
|
Post: #425  Posted: Tue Apr 20, 2010 8:25 am Post subject: Re: nkv in Unitech Posted: Tue Apr 20, 2010 8:25 am Post subject: Re: nkv in Unitech |
 |
|
Dear sir
Good observation.
Can you guide that how much candles you've calculated for EMA-1, 2 and 3.? I observed that your target is EMA-3 is it right?
Regards
Ashis
| msrimahidar wrote: | NVK in unitech
M.Sri Mahidar |
|
|
| Back to top |
|
 |
nvksrinivas
White Belt

Joined: 14 Aug 2006
Posts: 6
|
Post: #426  Posted: Tue Apr 20, 2010 10:07 pm Post subject: Posted: Tue Apr 20, 2010 10:07 pm Post subject: |
 |
|
After long time visiting the thread initiated by SAIKAT . Good going
and Good observation too Mr Mahidar - keep it up lets see how it unfolds in
Unitech
nvksrinivas
|
|
| Back to top |
|
 |
sunrays
White Belt

Joined: 19 Dec 2009
Posts: 71
|
Post: #427  Posted: Wed Apr 21, 2010 1:46 am Post subject: impact of a guru Posted: Wed Apr 21, 2010 1:46 am Post subject: impact of a guru |
 |
|
how deep n meaningful is the impact of nvksrinivas on saikat....
it clearly shows how a guru can impact the trading style of his student
saikat has done a fabulous job in forum........hats off both nvk srinivas n saikat .............great going 
|
|
| Back to top |
|
 |
tripathi_manu
White Belt

Joined: 27 Dec 2008
Posts: 62
|
Post: #428  Posted: Wed Apr 21, 2010 8:10 am Post subject: Posted: Wed Apr 21, 2010 8:10 am Post subject: |
 |
|
| nvksrinivas wrote: | After long time visiting the thread initiated by SAIKAT . Good going
and Good observation too Mr Mahidar - keep it up lets see how it unfolds in
Unitech
nvksrinivas |
Respected NVK sir,
People are very thankful to u and Saikat.
Regards
manu
|
|
| Back to top |
|
 |
Ravi_S
Yellow Belt

Joined: 15 Jun 2009
Posts: 569
|
|
| Back to top |
|
 |
sandythehellboy
White Belt

Joined: 15 Dec 2007
Posts: 21
|
Post: #430  Posted: Tue Apr 27, 2010 5:37 pm Post subject: NVK in Nifty Today Posted: Tue Apr 27, 2010 5:37 pm Post subject: NVK in Nifty Today |
 |
|
| [img]http://ichart.finance.yahoo.com/z?s=%5ENSEI&t=1d&q=c&l=on&z=l&p=&a=r14[/img]
|
|
| Back to top |
|
 |
shekharinvest
Yellow Belt

Joined: 21 Dec 2007
Posts: 549
|
Post: #431  Posted: Tue Apr 27, 2010 6:16 pm Post subject: Posted: Tue Apr 27, 2010 6:16 pm Post subject: |
 |
|
Hi,
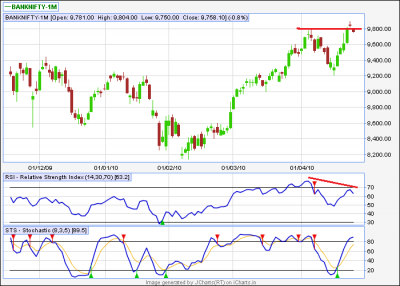
Here is Banknifty-1m EOD chart.
SHEKHAR
| Description: |
|
| Filesize: |
41.57 KB |
| Viewed: |
440 Time(s) |

|
|
|
| Back to top |
|
 |
Ravi_S
Yellow Belt

Joined: 15 Jun 2009
Posts: 569
|
Post: #432  Posted: Tue Apr 27, 2010 11:10 pm Post subject: Posted: Tue Apr 27, 2010 11:10 pm Post subject: |
 |
|
Shekar
How do you trade this setup, kind of Doji too at the top... Do you go short with a SL = High of 26 Apr 2010 (9900)? or wait for some retracement before going short
Regards
Ravi 
|
|
| Back to top |
|
 |
shekharinvest
Yellow Belt

Joined: 21 Dec 2007
Posts: 549
|
Post: #433  Posted: Wed Apr 28, 2010 9:13 am Post subject: Posted: Wed Apr 28, 2010 9:13 am Post subject: |
 |
|
Ravi,
I generally take positon when STS gives a sell and take high as the SL. In this case SL will be quite far. I wont take. If per chance it retraces and gives an opportunity to short with manageable SL, one should.
If you beleive it can go deep you can buy puts.
SHEKHAR
|
|
| Back to top |
|
 |
saikat
White Belt

Joined: 31 Mar 2008
Posts: 317
|
|
| Back to top |
|
 |
saikat
White Belt

Joined: 31 Mar 2008
Posts: 317
|
Post: #435  Posted: Wed Apr 28, 2010 12:56 pm Post subject: Posted: Wed Apr 28, 2010 12:56 pm Post subject: |
 |
|
| raghavacc wrote: | | saikat wrote: | Hello,
Today NVK worked very beautifully - the set up was quite good looking.
As I was not in SB that time - I couldn't shout 
But I hope it was too easy to notice and trade.
As I was already swing short since yesterday in April @ 5307
so I took intra long in May and as I was to go out for some time I had kept
a limit Sqr off order 5 points below morning high - which got hit after just 7 candles - thanks to 20 odd points premium in May that time 
That's why though on NS chart the high it made after trade entry doesn't look like anywhere near morning high - but the MAY future almost reached morning high.
Cheers !!!!!!!
Saikat |
Hello Saikat,
A novice type of question. Hope you wont mind.
The chart you have been attaching like one above are crystal clear.But in Finance.yahoo.com when I open interactive charts display of charts is somewhat differnt? Can you pls guide me how to customise the settings to make it appear like the one above?
Regards
Raghav |
Hello,
Asking 'novice type' questions are necessary steps of learning. 
I don't use interactive chart.
The one I use is the one I post here.
Just go through latest 4-5 pages of this thread - I had given the link to somebody here.
Regards,
Saikat
|
|
| Back to top |
|
 |
|

