| View previous topic :: View next topic |
| Author |
NVK SET UP |
sandythehellboy
White Belt

Joined: 15 Dec 2007
Posts: 21
|
Post: #451  Posted: Thu May 06, 2010 10:31 am Post subject: Dow NVK Intra Posted: Thu May 06, 2010 10:31 am Post subject: Dow NVK Intra |
 |
|
Hi,
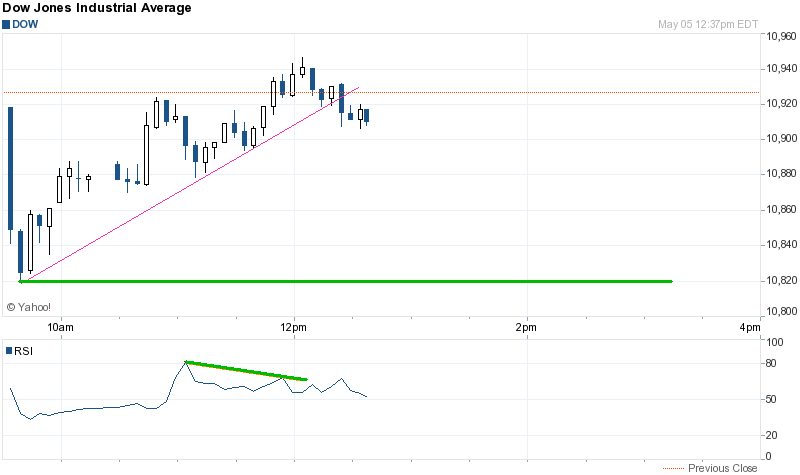
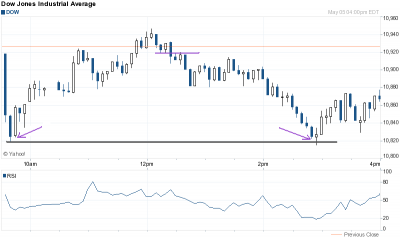
Finally i was successful in finding NVK  but unfortunately in Dow Jones but unfortunately in Dow Jones  . .
Yesterday night i didnt got time to post but late night i posted it on twitter.
Regards,
Sandesh Dalvi
| Description: |
|
| Filesize: |
11.08 KB |
| Viewed: |
2151 Time(s) |
|
| Description: |
|
| Filesize: |
12.34 KB |
| Viewed: |
416 Time(s) |
|
|
|
| Back to top |
|
 |
|
|
 |
mvnm
White Belt

Joined: 15 Aug 2008
Posts: 54
|
|
| Back to top |
|
 |
saikat
White Belt

Joined: 31 Mar 2008
Posts: 317
|
|
| Back to top |
|
 |
saikat
White Belt

Joined: 31 Mar 2008
Posts: 317
|
|
| Back to top |
|
 |
saikat
White Belt

Joined: 31 Mar 2008
Posts: 317
|
Post: #455  Posted: Thu May 06, 2010 3:20 pm Post subject: Posted: Thu May 06, 2010 3:20 pm Post subject: |
 |
|
Hi,
Nice going day!!! 
Booked the long @ 5098 for 68 points
and placed a limit short order @ 5110 ( 3 points below 23.6% level)
which also got filled
So now holding 50% short @ 5110
SL - hourly close above 34 EMA
TGt remains at 4947
Cheers!!!
Saikat
| saikat wrote: | Hi,
What a short it was @ 5130 yesterday at closing moment  WOW!! WOW!!
Shorting @ 13 EMA & 23.6% retracement absolutely rocked
Thought to hold till 4947 - but couldn't resist booking when I got 100 points today - so booked @ 5030.
The second reason was that NVK was forming on Hourly.
So also taken 1 Lot Long @ 5030 with SL 5 points below low ie 5020
Now plan is to book this long and short again when I get 13 EMA around again OR 5113 (23.6% of this fall 5398 - 5025).
If my Long SL is hit - ie if market falls without retracing towards 13 EMA - I will simply wait without position.
This market is most probably going towards 4947 (61.8%)
Cheers!!!!
Saikat
| saikat wrote: | Hi,
WOW!!! Wanted 200 points and at opening bell found 5060.
So booked rest 50% for 280 points  as a bounce back was expected. as a bounce back was expected.
The 23.6% of this fall (5398 - 5053) was at 5134 - so placed a limit short order @ 5130 for 50% quantity ( I always place 3-5 points inside from the actual FIB figure).
The short order was filled almost at last minute. 
This 5130 around is also 13 EMA on hourly - a perfect place from where the next phase of correction to start.
So now holding 50% short @ 5130 with SL hourly close above 34 EMA hourly.
Now my view is that if NF stays below 5119 - I will aim for 4947  . .
Cheers!!!!!
Saikat
| saikat wrote: | hi
Booked 50% shorts @ 5215 today.
No great TA.... Just wanted to take
home 125 points. Just in 3 days that
too while in vacation. 
will wait for 5119 or TSL for rest 50%
cheers!!
Saikat
| saikat wrote: | | saikat wrote: | Hello all,
My EOD NF view.
No NVK here - but thought to post here in this thread only so that I can easily monitor and discuss.
5479 is 78.6% of the big fall.
And 1-2% error in that big FIBO range is quite normal
5398 is within 2% of 5479. So a big correction may come.
Lets see......
Hold onto shorts and watch
Cheers !!! |
Hi,
Still EOD chart looks short only till the down TL is taken out.
My last swing shorts rest 25% got TSL hit but re entered shorts in MAY NF @ 5340 two days back when it retraced to test broken TL.
Looks like will get 200 points this time  ie Target is 5119 around. ie Target is 5119 around.
Once NF goes below EOD 34 EMA - just relax and hold shorts.
SL as of now is breaking of down TL - EOD close basis.
Thought to stay away from nifty while in vacation but the short looked very alluring  
Cheers !!!
Saikat |
|
|
|
|
|
| Back to top |
|
 |
Ravi_S
Yellow Belt

Joined: 15 Jun 2009
Posts: 569
|
|
| Back to top |
|
 |
saikat
White Belt

Joined: 31 Mar 2008
Posts: 317
|
Post: #457  Posted: Mon May 10, 2010 10:14 am Post subject: Posted: Mon May 10, 2010 10:14 am Post subject: |
 |
|
Hello,
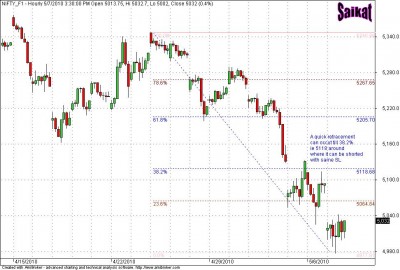
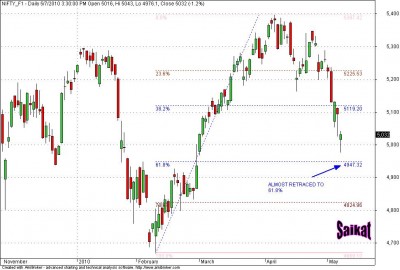
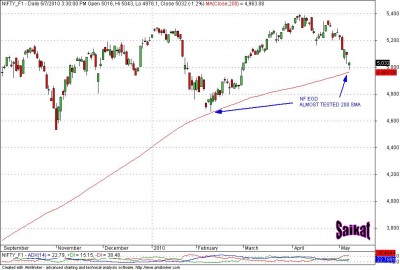
Last few days I was talking about support and possible trend reversal from around 4950 - 4970 area.
Let me put it in pictures  The three supports ...... The three supports ......
There is now also huge CLASS-A type Positive Div On hourly chart.
I was lucky to catch the almost low on friday (4977) to book another 25%
So now holding rest 25%.
now plan is to add back short near 34 EMA with 5118 SL
Cheers!!!!
Saikat
| Description: |
|
| Filesize: |
115.02 KB |
| Viewed: |
456 Time(s) |
|
| Description: |
|
| Filesize: |
93.33 KB |
| Viewed: |
442 Time(s) |
|
| Description: |
|
| Filesize: |
99.89 KB |
| Viewed: |
423 Time(s) |
|
| Description: |
|
| Filesize: |
89.67 KB |
| Viewed: |
417 Time(s) |

|
|
|
| Back to top |
|
 |
saikat
White Belt

Joined: 31 Mar 2008
Posts: 317
|
Post: #458  Posted: Mon May 10, 2010 10:26 am Post subject: Re: NVK - Bank Nifty Posted: Mon May 10, 2010 10:26 am Post subject: Re: NVK - Bank Nifty |
 |
|
| Ravi_S wrote: | Did anyone get this NVK setup in Bank Nifty on daily chart... Huge returns was on the cards...  |
Hi Ravi,
Wow!!!
great setup - absolutely clean set up
with 20 points SL it has given 600 points....  
Regards,
Saikat
|
|
| Back to top |
|
 |
smith06
White Belt

Joined: 05 May 2009
Posts: 12
|
Post: #459  Posted: Mon May 10, 2010 9:52 pm Post subject: Posted: Mon May 10, 2010 9:52 pm Post subject: |
 |
|
Hi Saikat,
Your analysis and trading of Nifty is excellent. I have learnt a few things
from it. Please carry on posting your trades. 
|
|
| Back to top |
|
 |
amitdate76
White Belt

Joined: 02 Feb 2009
Posts: 34
|
Post: #460  Posted: Mon May 10, 2010 10:57 pm Post subject: Posted: Mon May 10, 2010 10:57 pm Post subject: |
 |
|
Hi Saikat,
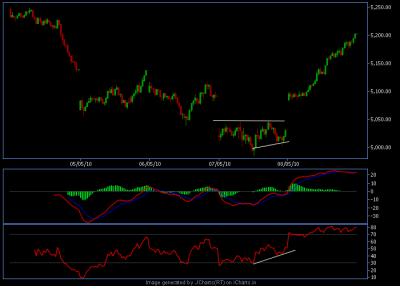
I have attached a latest 5 day chart of nifty and hav marked a possible positive divergence on a 10-min chart. Does the image represent a strong positive divergence. Also how cn one tell a positive divergence is strong enough.
Thanks,
Amit
| Description: |
|
| Filesize: |
15.04 KB |
| Viewed: |
412 Time(s) |
|
|
|
| Back to top |
|
 |
saikat
White Belt

Joined: 31 Mar 2008
Posts: 317
|
Post: #461  Posted: Tue May 11, 2010 12:53 am Post subject: Posted: Tue May 11, 2010 12:53 am Post subject: |
 |
|
Hi,
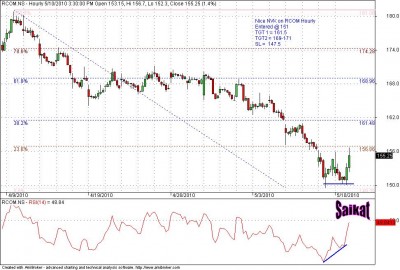
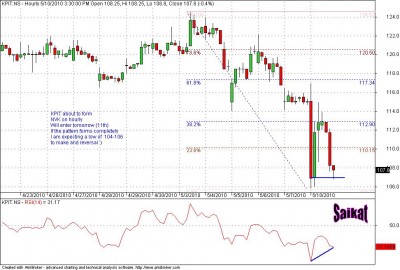
Posting 2 charts.
One entry taken today
Another mostly tomorrow (11th)
Cheers!!!
Saikat
| Description: |
|
| Filesize: |
124.24 KB |
| Viewed: |
437 Time(s) |
|
| Description: |
|
| Filesize: |
120.28 KB |
| Viewed: |
422 Time(s) |
|
|
|
| Back to top |
|
 |
saikat
White Belt

Joined: 31 Mar 2008
Posts: 317
|
Post: #462  Posted: Tue May 11, 2010 1:03 am Post subject: Posted: Tue May 11, 2010 1:03 am Post subject: |
 |
|
| amitdate76 wrote: | Hi Saikat,
I have attached a latest 5 day chart of nifty and hav marked a possible positive divergence on a 10-min chart. Does the image represent a strong positive divergence. Also how cn one tell a positive divergence is strong enough.
Thanks,
Amit |
Hello Amit,
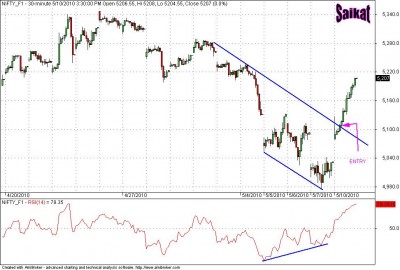
The way you have marked your chart, it is NOT showing +ve Divergence.
The +ve Div formed on 30 mins and hourly charts.
Posting a 30 mins NF chart.
You need to take the entry at the pink arrow point.
Regards,
Saikat
| Description: |
|
| Filesize: |
107.04 KB |
| Viewed: |
438 Time(s) |
|
|
|
| Back to top |
|
 |
saikat
White Belt

Joined: 31 Mar 2008
Posts: 317
|
Post: #463  Posted: Tue May 11, 2010 1:06 am Post subject: Posted: Tue May 11, 2010 1:06 am Post subject: |
 |
|
| smith06 wrote: | Hi Saikat,
Your analysis and trading of Nifty is excellent. I have learnt a few things
from it. Please carry on posting your trades.  |
Hi,
Thanks...
Trying to give back what I have got from here only and mastered a little bit may be......
Teaching & sharing are the best way to learn.
Regards,
Saikat
|
|
| Back to top |
|
 |
sandew
White Belt

Joined: 02 Feb 2009
Posts: 174
|
Post: #464  Posted: Tue May 11, 2010 5:22 am Post subject: Hi Posted: Tue May 11, 2010 5:22 am Post subject: Hi |
 |
|
Saikat,
There is a total different trade set up on 30 min chart when using Amibroker, and when using Icharts - Jcharts - for May 10
With Amibroker it is a breakout, as you hv pointed in your chart.
With icharts the price as shown on 30 min chart opened way above the falling trendline (unlike Amibroker , where price is placed below trendline). So, the set up with Icharts for entry is ORB instead(aggressive) , or break of recovery high (conservative trade), instead.
(for chart see post by Speculator on May 11 in his thread #2230)
Last edited by sandew on Wed May 12, 2010 9:54 am; edited 1 time in total |
|
| Back to top |
|
 |
Ravi_S
Yellow Belt

Joined: 15 Jun 2009
Posts: 569
|
|
| Back to top |
|
 |
|

