| View previous topic :: View next topic |
| Author |
NVK SET UP |
natarajmtech
White Belt

Joined: 13 Oct 2008
Posts: 61
|
Post: #61  Posted: Thu Sep 24, 2009 9:18 am Post subject: Posted: Thu Sep 24, 2009 9:18 am Post subject: |
 |
|
| shekharinvest wrote: | HI
Posting todays chart. Two clear setups marked on it.
Natraj, please see the divergence marked on the first setup. Its different from what you have marked.
Nilesh, you will find in previous post, How to attach the charts. You are quick enough to identify the setup.
SHEKHAR |
Hi Shekhar,
I tried to post this message yesterday but the icharts webpage showed up error for all my login attempt on yesterday. For the first set up , I was expecting a dip in nifty as RSI climbing up as mentioned in my previous chart but that was not happened (see my chart). The RSI, what you marked in your chart is not showing any visible diversion though it is a well defined double bottom. Whereas Nilesh is indeed very smart in identifying the trend very quickly in second setup and there too as per his mentioning the diversion started at 1:45PM and short entry is possible close to 2:30PM. The NVK setup is most noticeable and tradable opportunity as shown in the chart then the one you have mentioned. Since the trend line that you have drawn from 1:15pm is very difficult to judge the direction of the RSI from that point onwards. So now the question is which is the double top for today setup.
So NVK setup happen time and again but it become too subjective for a right entry. Please clarify me if I am wrong.
Note: Please read attached chart for further on my view.
Regards,
Nataraj
| Description: |
|
| Filesize: |
15.94 KB |
| Viewed: |
580 Time(s) |
|
|
|
| Back to top |
|
 |
|
|
|
shekharinvest
Yellow Belt

Joined: 21 Dec 2007
Posts: 549
|
| Post: #62 Posted: Thu Sep 24, 2009 9:39 am Post subject: |
|
|
Natraj,
I will try to post detailed explanation in the evening.
SHEKHAR
|
|
| Back to top |
|
|
simran8998
White Belt
Joined: 19 Mar 2009
Posts: 34
|
| Post: #63 Posted: Thu Sep 24, 2009 12:11 pm Post subject: 24th september 2009 |
|
|
Hi all,
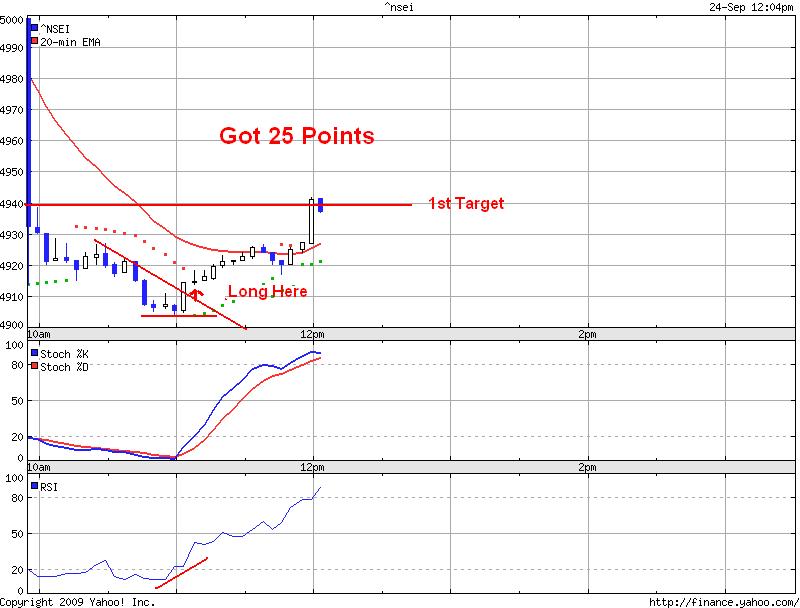
I have attached today's trade acc to NVK. It rocks guys
| Description: |
|
| Filesize: |
69.21 KB |
| Viewed: |
2501 Time(s) |
|
|
|
| Back to top |
|
|
natarajmtech
White Belt
Joined: 13 Oct 2008
Posts: 61
|
| Post: #64 Posted: Thu Sep 24, 2009 12:33 pm Post subject: |
|
|
Hi all,
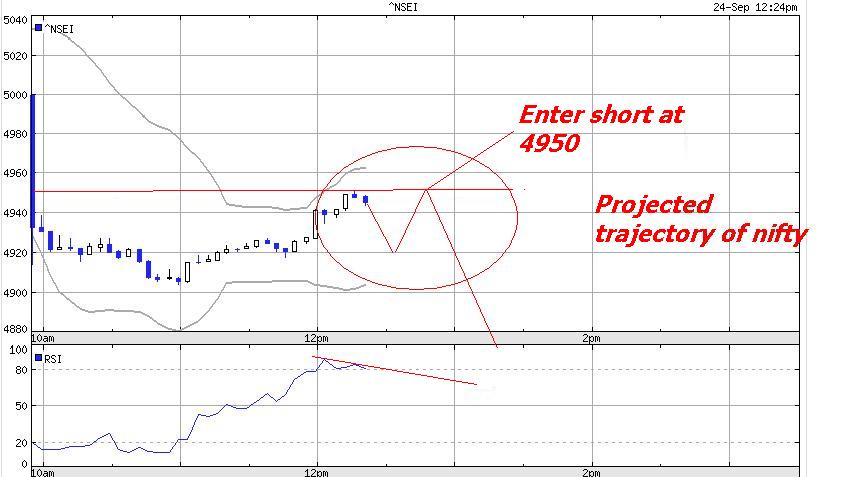
Another oppertunity in short side is on formation
See graph it is self explanatory
Note: Simran , could you please explain your chart of nifty long based on NVK setup.
Regards,
Nataraj
| Description: |
|
| Filesize: |
57.89 KB |
| Viewed: |
2507 Time(s) |
|
|
|
| Back to top |
|
|
simran8998
White Belt
Joined: 19 Mar 2009
Posts: 34
|
| Post: #65 Posted: Thu Sep 24, 2009 12:40 pm Post subject: |
|
|
Hi,
natarajmtech
it is self explanatory.
Long Nifty as it makes double bottom and rsi is increasing. Target day's high
|
|
| Back to top |
|
|
natarajmtech
White Belt
Joined: 13 Oct 2008
Posts: 61
|
| Post: #66 Posted: Thu Sep 24, 2009 12:49 pm Post subject: |
|
|
| simran8998 wrote: | Hi,
natarajmtech
it is self explanatory.
Long Nifty as it makes double bottom and rsi is increasing. Target day's high |
Thanks but double bottom is very thin to call it as a double bottom.. So you entered at break of the downward trend line ...good that was not strike to me at a first look of your chart.
ok so you booked based at 4940 based on fibonacci retracement of 38.2% ? Good work...keep posting
Regards,
Nataraj
|
|
| Back to top |
|
|
simran8998
White Belt
Joined: 19 Mar 2009
Posts: 34
|
| Post: #67 Posted: Thu Sep 24, 2009 12:59 pm Post subject: |
|
|
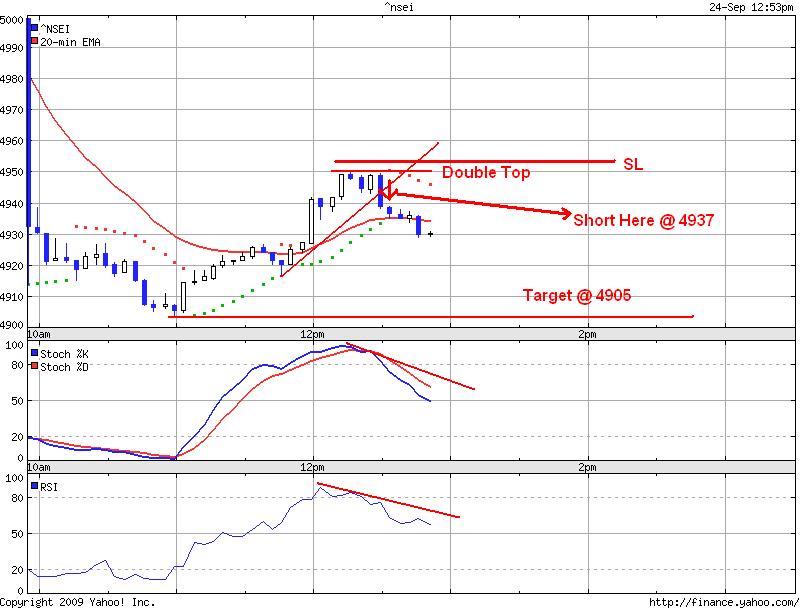
Hi,
Another Trade acc to NVK.
I think it is self explainatory that's why i am not explaning
| Description: |
|
| Filesize: |
77.02 KB |
| Viewed: |
2479 Time(s) |
|
|
|
| Back to top |
|
|
natarajmtech
White Belt
Joined: 13 Oct 2008
Posts: 61
|
| Post: #68 Posted: Thu Sep 24, 2009 1:55 pm Post subject: |
|
|
| simran8998 wrote: | Hi,
Another Trade acc to NVK.
I think it is self explainatory that's why i am not explaning |
I belive it is going to be played in long side now...as per my chart..if you strickly follow Saikat for NVK seup
Regards,
Nataraj
| Description: |
|
| Filesize: |
58.83 KB |
| Viewed: |
2482 Time(s) |
|
|
|
| Back to top |
|
|
simran8998
White Belt
Joined: 19 Mar 2009
Posts: 34
|
| Post: #69 Posted: Thu Sep 24, 2009 2:48 pm Post subject: |
|
|
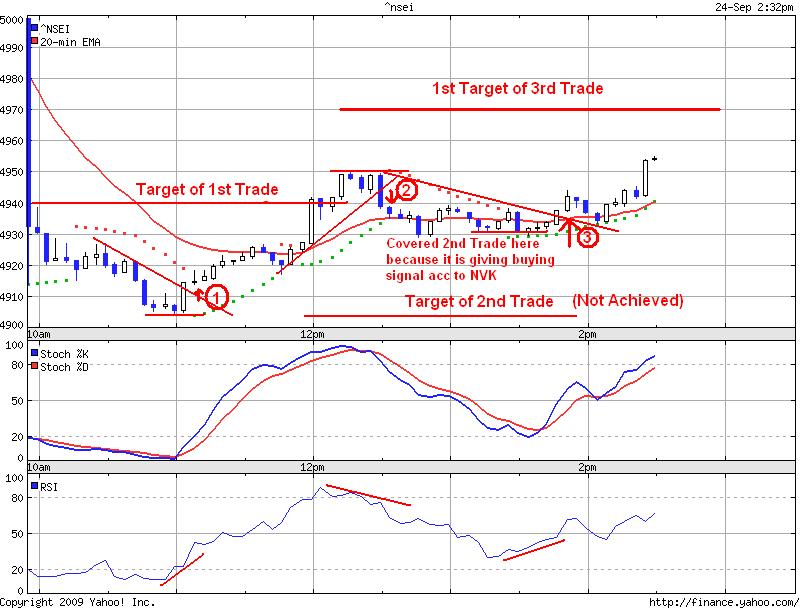
Hi,
I am positing all 3 trades of today in Nifty acc to NVK. Please check attachment
| Description: |
|
| Filesize: |
89.77 KB |
| Viewed: |
2466 Time(s) |
|
|
|
| Back to top |
|
|
simran8998
White Belt
Joined: 19 Mar 2009
Posts: 34
|
| Post: #70 Posted: Thu Sep 24, 2009 3:10 pm Post subject: |
|
|
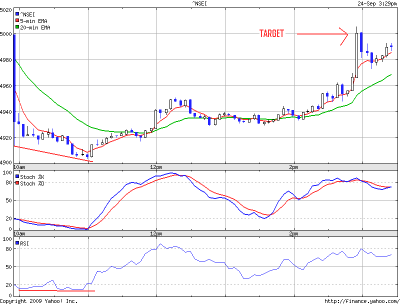
Hi,
Both target of 3rd trade achieved
1st target was 4970
2nd target was 5000
Total points today 75-80
hurray
 
|
|
| Back to top |
|
|
natarajmtech
White Belt
Joined: 13 Oct 2008
Posts: 61
|
| Post: #71 Posted: Thu Sep 24, 2009 3:24 pm Post subject: |
|
|
| natarajmtech wrote: | | simran8998 wrote: | Hi,
Another Trade acc to NVK.
I think it is self explainatory that's why i am not explaning |
I belive it is going to be played in long side now...as per my chart..if you strickly follow Saikat for NVK seup
Regards,
Nataraj |
Though I am not traded I am happy for those who are traded based on the Long trade based on NVK setup in my chart today...and today there is only one tradable opportunity (if you can follow Strictly NVK setup rules of Saikat)
Regards,
Nataraj
|
|
| Back to top |
|
|
shekharinvest
Yellow Belt
Joined: 21 Dec 2007
Posts: 549
|
| Post: #72 Posted: Thu Sep 24, 2009 4:32 pm Post subject: |
|
|
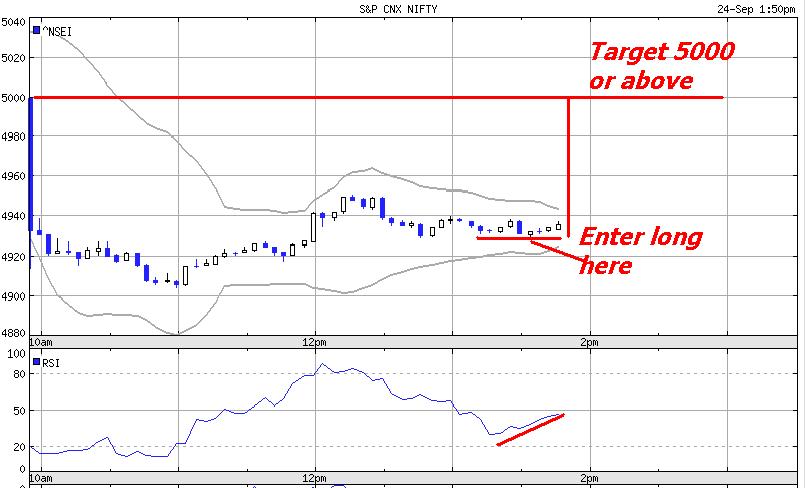
Hi,
Great activity and nice innovation/insight seen here.
How you guys have given new interpretation to this setup is worthwhile. Smaller RSI divegence within intermediate double tops and hence smaller targets.
I am posting the chart as I have seen the setup. Frankly saying I did not had the guts to go long at that point of time (using NVK).
Firstly it was based on first candle which was very large secondly indicator (RSI) values are distorted with such a large variation and it take couple of candles for indicator to adjust and I could not draw the trend line from top, to enter safely as well.
For the first time I have seen such a high target. But I was sure that I had spotted it correctly and it might do 5000 and it did in the end.
SHEKHAR
| Description: |
|
| Filesize: |
11.92 KB |
| Viewed: |
629 Time(s) |
|
|
|
| Back to top |
|
|
simran8998
White Belt
Joined: 19 Mar 2009
Posts: 34
|
| Post: #73 Posted: Thu Sep 24, 2009 4:37 pm Post subject: |
|
|
Hi, natarajmtech
I want to clear you one thing that market open gap down and made a high of around 4940 (after opening) so acc to NVK target of first trade become 4940. This is problem with Nifty that it don't show gap up or gap down. You can check a chart of sensex, there you will get gap up or gap down clearly
|
|
| Back to top |
|
|
natarajmtech
White Belt
Joined: 13 Oct 2008
Posts: 61
|
| Post: #74 Posted: Thu Sep 24, 2009 4:59 pm Post subject: |
|
|
| shekharinvest wrote: | Hi,
Great activity and nice innovation/insight seen here.
How you guys have given new interpretation to this setup is worthwhile. Smaller RSI divegence within intermediate double tops and hence smaller targets.
I am posting the chart as I have seen the setup. Frankly saying I did not had the guts to go long at that point of time (using NVK).
Firstly it was based on first candle which was very large secondly indicator (RSI) values are distorted with such a large variation and it take couple of candles for indicator to adjust and I could not draw the trend line from top, to enter safely as well.
For the first time I have seen such a high target. But I was sure that I had spotted it correctly and it might do 5000 and it did in the end.
SHEKHAR |
Hi Shekhar,
The RSI in the setup of yours either look trending down or flat (we need upward diversion alright ?) and also the double bottom occured after 1hour time span so both way it is not tradable as per Saikat set rules.
To Simran,
For the first setup the RSI diversion (positive) started at the dip of second bottom ( but as per Saikat the upward diversion should be visible from the the first bottom itself so you can carry on the trade at the second bottom) so it is violating Saikat setup
In your second setup , Saikat NVK setup says double top or higher high, but what you have mentioned is lower high in the second top of the double top.
I agree that technical analysis is too subjective...Please substantiate your trading based on NVK setup if you are also considering any other factors to take a call for an entry.
Today I am thankful for Simran...he/she introuduced Slow stochiastic chart in the NVK setup..it looks great that its signal conincide with the NVK setup very well.
Thanks all of you.
Nataraj
|
|
| Back to top |
|
|
natarajmtech
White Belt
Joined: 13 Oct 2008
Posts: 61
|
| Post: #75 Posted: Fri Sep 25, 2009 10:36 am Post subject: |
|
|
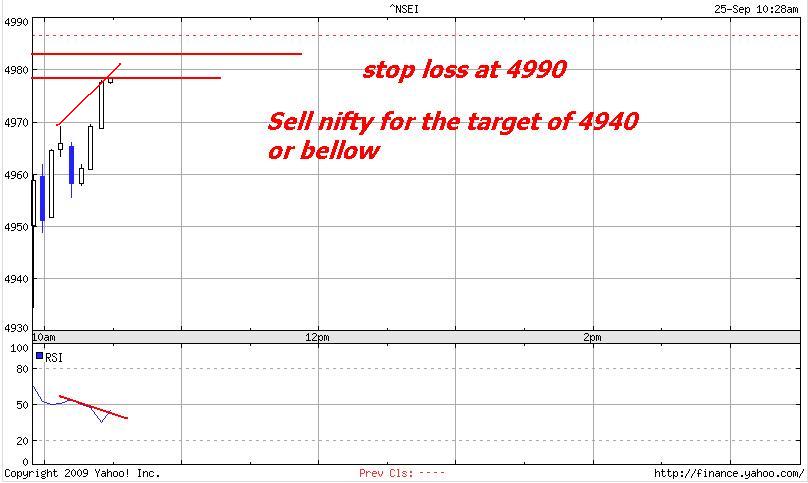
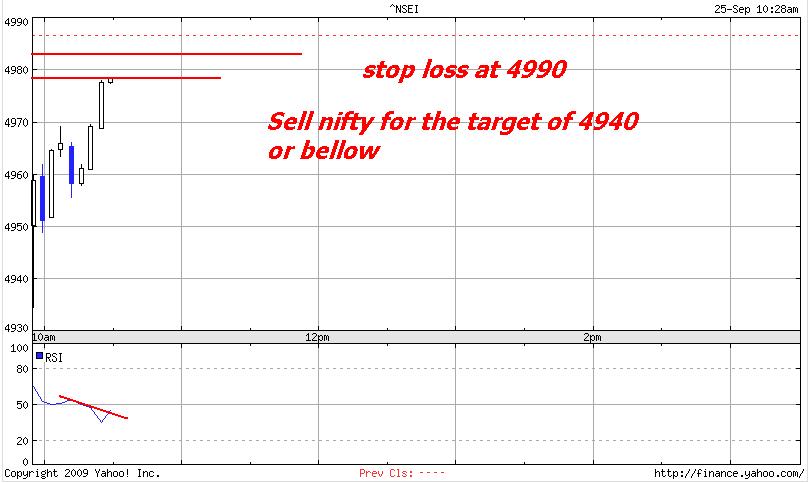
Hi all,
The double top still not formed but it looks an yet another opertunity to go short for a target of 4940 or below...
See attachment for the NVK setup for a shor trade today
Please wait for the second top formation to confirm...and adjust the stop loss accordingly.
Regards,
Nataraj
| Description: |
|
| Filesize: |
51.85 KB |
| Viewed: |
2411 Time(s) |
|
| Description: |
|
| Filesize: |
51.92 KB |
| Viewed: |
2412 Time(s) |
|
|
|
| Back to top |
|
|
|


