|
|
| View previous topic :: View next topic |
| Author |
NVK SET UP |
simran8998
White Belt

Joined: 19 Mar 2009
Posts: 34
|
Post: #91  Posted: Fri Sep 25, 2009 2:08 pm Post subject: Posted: Fri Sep 25, 2009 2:08 pm Post subject: |
 |
|
| natarajmtech then how will you judge which NVK setup is to follow. either long or short because today both setup were build
|
|
| Back to top |
|
 |
|
|  |
natarajmtech
White Belt

Joined: 13 Oct 2008
Posts: 61
|
Post: #92  Posted: Fri Sep 25, 2009 2:10 pm Post subject: Posted: Fri Sep 25, 2009 2:10 pm Post subject: |
 |
|
| simran8998 wrote: | | natarajmtech wrote: | | simran8998 wrote: | | natarajmtech wrote: | | natarajmtech wrote: | Hi all,
The double top still not formed but it looks an yet another opertunity to go short for a target of 4940 or below...
See attachment for the NVK setup for a shor trade today
Please wait for the second top formation to confirm...and adjust the stop loss accordingly.
Regards,
Nataraj |
Great ...nifty at 4950...hope you guys raised stop loss to 5000 after seeing top of the NVK setup proposed by me at 4989.
I think can continue to hold the nifty for the target of 4940 or below since it already taken the fibonacci retracement of 4954 level also.
Regards,
Nataraj |
Hi,
You can not consider it as double top or slightly higher high because it high by around 20 points so this is not a NVK setup |
Saikat mentioed slight higher high but some where it become to high also so the catch here is the steep fall of RSI as double peak in formation.
So in all possiblity it is fulfilling NVK setup.
And also it is not possible to cluster more than one NVK setup within the NVK setup....as you are doing it here..it is too confuing
Regards,
Nataraj |
Then how will you judge which NVK setup is to follow. either long or short because today both setup were build |
Hi Simran,
It is the matter how good we are in picking up the first NVK setup since we are all trying to predict the course of action of larger market player and how they want to play it today...so once we identified the first setup we have to wait for that setup to break convincingly...
Since the trend for the day (larger movement of nifty either up or down) is fixed at once and the intermediate pattern could just be served to distort our focus.
Regards,
Nataraj
|
|
| Back to top |
|
 |
simran8998
White Belt

Joined: 19 Mar 2009
Posts: 34
|
Post: #93  Posted: Fri Sep 25, 2009 2:13 pm Post subject: Posted: Fri Sep 25, 2009 2:13 pm Post subject: |
 |
|
| Thanks for your advice natarajmtech. You means to say that we have to pick first NVK setup & then wait for it
|
|
| Back to top |
|
 |
natarajmtech
White Belt

Joined: 13 Oct 2008
Posts: 61
|
Post: #94  Posted: Fri Sep 25, 2009 2:30 pm Post subject: Posted: Fri Sep 25, 2009 2:30 pm Post subject: |
 |
|
| simran8998 wrote: | | Thanks for your advice natarajmtech. You means to say that we have to pick first NVK setup & then wait for it |
Hi Simran,
Yes, missing the right NVK will cost you more. Say for today, the first setup proposed by me got the high of 4989 as top and after some time an another double top and RSI (-ve) diversion happened proposed by you (a good NVK setup no fault in it) and for that the 10 points stop loss triggered (so missing first setup cost you) and again you went long and again the market showed some small profit and that pattern brought you an unwanted diversion and made you to miss a large profit in short side, in fact market did not give you any chance to enter in short side as it fell very steeply to hit the target of first setup.
Understand the FII taking ride of our psychology and we should not fall pray for that.
That is way the big market player play to divert us like small retail traders.
Regards,
Nataraj
|
|
| Back to top |
|
 |
simran8998
White Belt

Joined: 19 Mar 2009
Posts: 34
|
Post: #95  Posted: Fri Sep 25, 2009 3:08 pm Post subject: Posted: Fri Sep 25, 2009 3:08 pm Post subject: |
 |
|
natarajmtech,
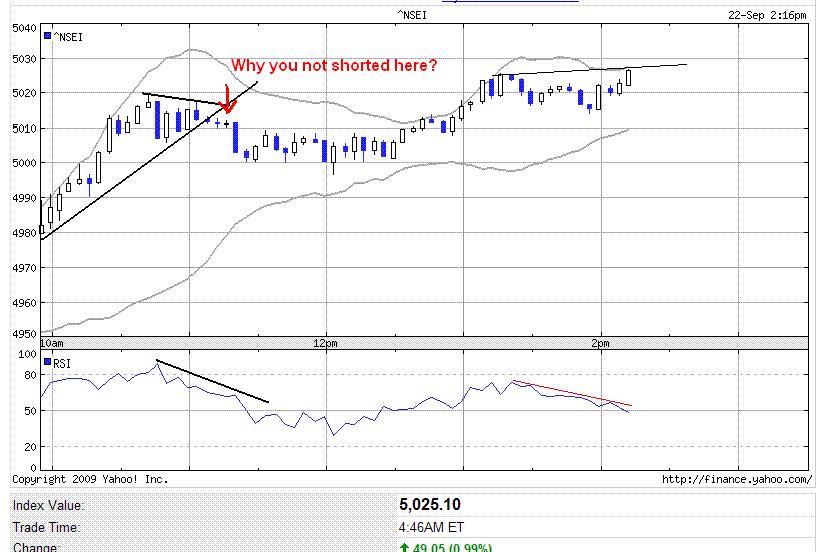
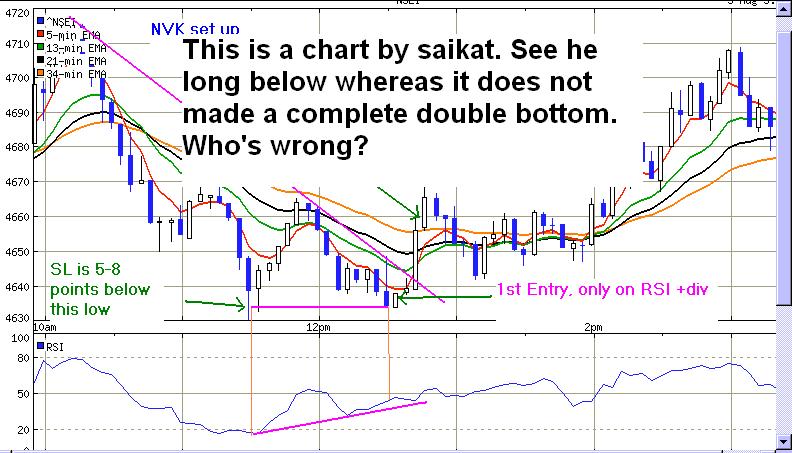
There is very much confusion. See the chart of 22nd sep (attached below) and chart posted by saikat
| Description: |
|
| Filesize: |
78.48 KB |
| Viewed: |
2213 Time(s) |
|
| Description: |
|
| Filesize: |
84.42 KB |
| Viewed: |
2213 Time(s) |
|
|
|
| Back to top |
|
 |
natarajmtech
White Belt

Joined: 13 Oct 2008
Posts: 61
|
Post: #96  Posted: Fri Sep 25, 2009 3:22 pm Post subject: Posted: Fri Sep 25, 2009 3:22 pm Post subject: |
 |
|
| simran8998 wrote: | natarajmtech,
There is very much confusion. See the chart of 22nd sep (attached below) and chart posted by saikat |
Hi Simran,
The Saikat chart is representation of a well defined double bottom and even a lay man can spot it as a double bottom where we do not need to speculate much of its bottom points (it is acceptable) but what you have mentioned in another chart is speculative to a lay men to call it as a double top...so here have to take a call based on intuition which is gained by a persona based on his/her experience.
Regards,
Nataraj
|
|
| Back to top |
|
 |
simran8998
White Belt

Joined: 19 Mar 2009
Posts: 34
|
Post: #97  Posted: Fri Sep 25, 2009 3:26 pm Post subject: Posted: Fri Sep 25, 2009 3:26 pm Post subject: |
 |
|
natarajmtech
Check it clearly Low of 1st bottom is 4630 whereas low of 2nd bottom is 4635 so how can you say it as double bottom
|
|
| Back to top |
|
 |
natarajmtech
White Belt

Joined: 13 Oct 2008
Posts: 61
|
Post: #98  Posted: Fri Sep 25, 2009 3:33 pm Post subject: Posted: Fri Sep 25, 2009 3:33 pm Post subject: |
 |
|
| simran8998 wrote: | natarajmtech
Check it clearly Low of 1st bottom is 4630 whereas low of 2nd bottom is 4630 so how can you say it as double bottom |
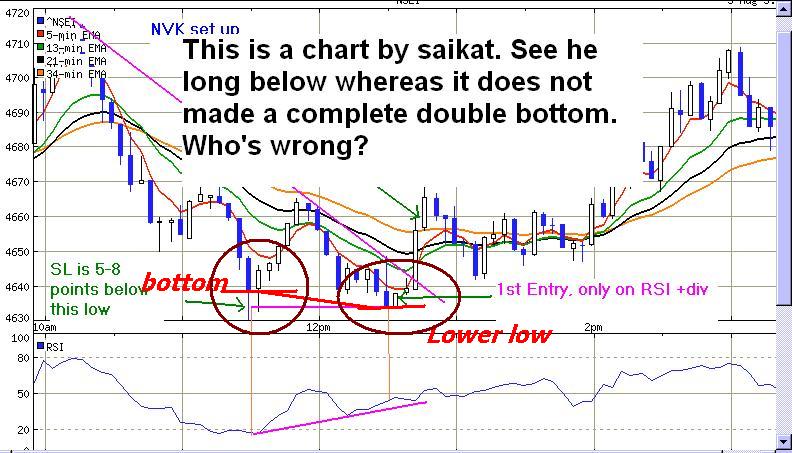
See, If you are convinced the setup is double bottom (well defined) then you do not need to worry about any thing. Incase if you have doubt about the NVK setup for short side as RSI showing negative diversion then you have to check that atleast the second bottom under the scanner is making lower low than the previous bottom.
Note: see also the chart, the bottom of the two curve is making lower low...so fulfil the Saikat setup criteria..alright ?
Regards,
Nataraj
| Description: |
|
| Filesize: |
87.23 KB |
| Viewed: |
2250 Time(s) |
|
|
|
| Back to top |
|
 |
kiran.jain
White Belt

Joined: 31 Jan 2008
Posts: 47
Location: mumbai
|
Post: #99  Posted: Sun Sep 27, 2009 10:56 am Post subject: interpretation Posted: Sun Sep 27, 2009 10:56 am Post subject: interpretation |
 |
|
candle in nothing but collection of information of price movement in given time frame......so if one decode in laymens language what system say is let the market find the supply zone(for shorting) or buying zone and then initiate the trade.... let it b double or triple bottom or top... its says at that level supply is comming in and people dont want that level 2 break.... candle also say the same thing... so if one analyze the candles patten he would get the level or zone which would act as resistance or support.... this system also says and do same thing.... at the end its price movement.. and buy drawing line v r just define the zone or level...
just tried 2 explain what the system wanna say... 
i know m bad i writing theory and explaining .. so kindly bare with it...  
enjoy
_________________
keep smiling  |
|
| Back to top |
|
 |
shekharinvest
Yellow Belt

Joined: 21 Dec 2007
Posts: 549
|
Post: #100  Posted: Mon Sep 28, 2009 4:46 pm Post subject: Posted: Mon Sep 28, 2009 4:46 pm Post subject: |
 |
|
HI,
What I have been posting under the NVK setup are based on the principal of divergence between movement of the price and the movement of the indicators (RSI) in this case. The same principle that is behind the NVK Setup. Hence, most of the charts posted by me were not exact as per NVK setup, but they never failed on the principle front, ie. divergence between price and RSI.
People who might have seen my intial post might remember that I had commented that I have been observing divergence between price and RSI - and STS as well, the only contribution (and the major one) this setup has provided was the targets for the day.
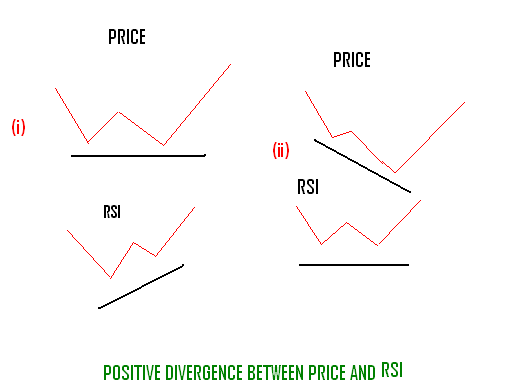
Some of the people here have not fully grasped the concept of divergence. We may have divergence in the following two ways.
i) Whenever, price makes a low and RSI makes a corresponding low and then it moves up and price again makes a new low or comes closer to previous low and the RSI fails to make a corresponding new low i.e. RSI make a higher low, it is a divergence. In this case we might see a double bottom on the price chart .
ii) Whenever, price makes a low and RSI makes a corresponding low and it continues to go further down after a momentary stay at that point of time to make a new low we will see that RSI has not followed the price to make a new low, whereas, it is presenting a picture suggestive of double bottom on RSI, it is also a divergence, and must be treated in a similar fashion as the one above.
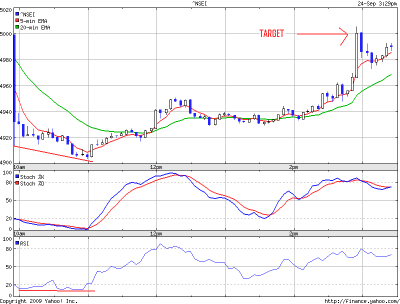
Attached below is the chart, which clearly show the positive divergence of two types. We look for –ve divergence at the top.
Also, attached is the chart for NIFTY of Sept. 24. I think I have explained myself on that.
In the next post I will try to re-state the NVK setup.
DUSSHERA GREETINGS !
SHEKHAR
| Description: |
|
| Filesize: |
9.3 KB |
| Viewed: |
2356 Time(s) |
|
| Description: |
|
| Filesize: |
11.92 KB |
| Viewed: |
522 Time(s) |
|
|
|
| Back to top |
|
 |
charav
White Belt

Joined: 18 May 2009
Posts: 15
|
Post: #101  Posted: Mon Sep 28, 2009 9:51 pm Post subject: NVK setup Posted: Mon Sep 28, 2009 9:51 pm Post subject: NVK setup |
 |
|
Hello everybody. The so called NVK setup is explained in simple manner by Dr Elder Alexander in his book " Trading for a living" - page no 159(144). The pdf may be available at
http://www.pdf-search-engine.com/trading-for-a-living-pdf.html
However, the riders attached by Saikat are what that differentiates NVK setup from Dr Elder's setup. Regards.
|
|
| Back to top |
|
 |
natarajmtech
White Belt

Joined: 13 Oct 2008
Posts: 61
|
Post: #102  Posted: Tue Sep 29, 2009 9:29 am Post subject: Posted: Tue Sep 29, 2009 9:29 am Post subject: |
 |
|
| shekharinvest wrote: | HI,
What I have been posting under the NVK setup are based on the principal of divergence between movement of the price and the movement of the indicators (RSI) in this case. The same principle that is behind the NVK Setup. Hence, most of the charts posted by me were not exact as per NVK setup, but they never failed on the principle front, ie. divergence between price and RSI.
People who might have seen my intial post might remember that I had commented that I have been observing divergence between price and RSI - and STS as well, the only contribution (and the major one) this setup has provided was the targets for the day.
Some of the people here have not fully grasped the concept of divergence. We may have divergence in the following two ways.
i) Whenever, price makes a low and RSI makes a corresponding low and then it moves up and price again makes a new low or comes closer to previous low and the RSI fails to make a corresponding new low i.e. RSI make a higher low, it is a divergence. In this case we might see a double bottom on the price chart .
ii) Whenever, price makes a low and RSI makes a corresponding low and it continues to go further down after a momentary stay at that point of time to make a new low we will see that RSI has not followed the price to make a new low, whereas, it is presenting a picture suggestive of double bottom on RSI, it is also a divergence, and must be treated in a similar fashion as the one above.
Attached below is the chart, which clearly show the positive divergence of two types. We look for –ve divergence at the top.
Also, attached is the chart for NIFTY of Sept. 24. I think I have explained myself on that.
In the next post I will try to re-state the NVK setup.
DUSSHERA GREETINGS !
SHEKHAR |
Hi Shekhar,
Great , Thanks for your excellent explanation regarding divergence with nice illustrative examples. Looking forward to learn more from you.
Regards,
Nataraj
|
|
| Back to top |
|
 |
natarajmtech
White Belt

Joined: 13 Oct 2008
Posts: 61
|
Post: #103  Posted: Tue Sep 29, 2009 12:44 pm Post subject: Posted: Tue Sep 29, 2009 12:44 pm Post subject: |
 |
|
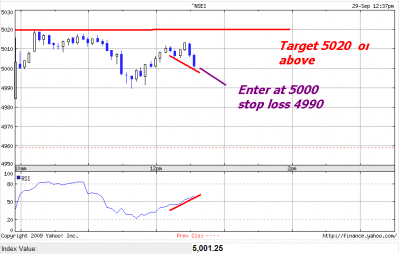
Hi everyone,
I have posted the anticipated the NVK setup for long trade now...
Now spot nifty at 5008
See attachment for the explanation.
Regards,
Nataraj
| Description: |
|
| Filesize: |
22.01 KB |
| Viewed: |
519 Time(s) |
|
|
|
| Back to top |
|
 |
simran8998
White Belt

Joined: 19 Mar 2009
Posts: 34
|
Post: #104  Posted: Tue Sep 29, 2009 1:29 pm Post subject: Posted: Tue Sep 29, 2009 1:29 pm Post subject: |
 |
|
hi, natarajmtech
I don't think it is right NVK setup. Kindly check
|
|
| Back to top |
|
 |
simran8998
White Belt

Joined: 19 Mar 2009
Posts: 34
|
Post: #105  Posted: Tue Sep 29, 2009 1:39 pm Post subject: Posted: Tue Sep 29, 2009 1:39 pm Post subject: |
 |
|
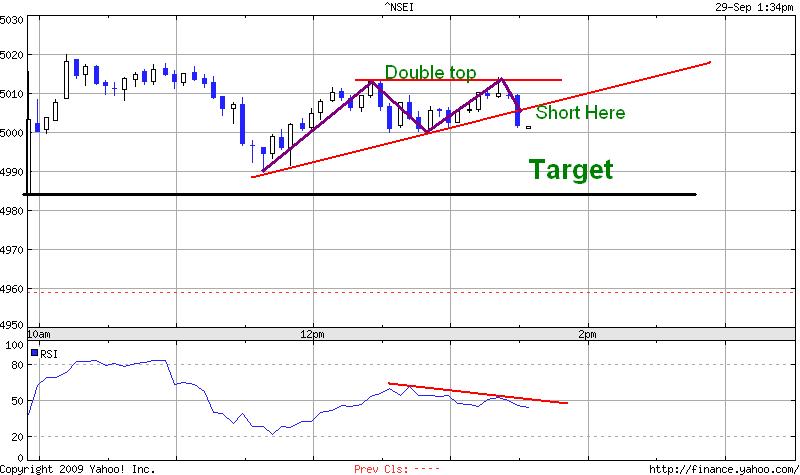
Hi all,
See NVK setup below
| Description: |
|
| Filesize: |
57.51 KB |
| Viewed: |
2444 Time(s) |
|
|
|
| Back to top |
|
 |
|
|
You cannot post new topics in this forum
You cannot reply to topics in this forum
You cannot edit your posts in this forum
You cannot delete your posts in this forum
You cannot vote in polls in this forum
You can attach files in this forum
You can download files in this forum
|
Powered by phpBB © 2001, 2005 phpBB Group
|
|
|

