| View previous topic :: View next topic |
| Author |
patterns and trend |
ajeya12
White Belt

Joined: 30 Oct 2011
Posts: 132
|
|
| Back to top |
|
 |
|
|
|
vinay28
Black Belt

Joined: 24 Dec 2010
Posts: 11748
|
Post: #2  Posted: Fri May 03, 2013 8:25 am Post subject: Posted: Fri May 03, 2013 8:25 am Post subject: |
 |
|
| weekly flag gives much much higher target
|
|
| Back to top |
|
|
ajeya12
White Belt
Joined: 30 Oct 2011
Posts: 132
|
| Post: #3 Posted: Fri May 03, 2013 8:34 am Post subject: |
|
|
| vinay28 wrote: | | weekly flag gives much much higher target |
Hi Vinay, this is for today.thank u
|
|
| Back to top |
|
|
apka
Black Belt
Joined: 13 Dec 2011
Posts: 6137
|
| Post: #4 Posted: Fri May 03, 2013 9:52 am Post subject: |
|
|
| now that 5970 has come the flag has broken right
|
|
| Back to top |
|
|
vinay28
Black Belt
Joined: 24 Dec 2010
Posts: 11748
|
| Post: #5 Posted: Fri May 03, 2013 10:06 am Post subject: |
|
|
| apka wrote: | | now that 5970 has come the flag has broken right |
no apka, flag fails below 5930 but target has got reduced now due to fall
|
|
| Back to top |
|
|
ajeya12
White Belt
Joined: 30 Oct 2011
Posts: 132
|
| Post: #6 Posted: Fri May 03, 2013 10:36 am Post subject: |
|
|
| vinay28 wrote: | | apka wrote: | | now that 5970 has come the flag has broken right |
no apka, flag fails below 5930 but target has got reduced now due to fall |
In the flag pattern the candle should break the top of the cloth to get the tgt. Now it is showing some retracement because of the policy.but it should take support near 5950 --5960. FOR UPPER TGTS lets c.
|
|
| Back to top |
|
|
apka
Black Belt
Joined: 13 Dec 2011
Posts: 6137
|
| Post: #7 Posted: Fri May 03, 2013 10:42 am Post subject: |
|
|
| vinay28 wrote: | | apka wrote: | | now that 5970 has come the flag has broken right |
no apka, flag fails below 5930 but target has got reduced now due to fall |
i had it mind for some reason if immediate upside doesnt come and downside comes then pattern has broken...
|
|
| Back to top |
|
|
ajeya12
White Belt
Joined: 30 Oct 2011
Posts: 132
|
| Post: #8 Posted: Fri May 03, 2013 11:18 am Post subject: |
|
|
| ajeya12 wrote: | | vinay28 wrote: | | apka wrote: | | now that 5970 has come the flag has broken right |
no apka, flag fails below 5930 but target has got reduced now due to fall |
In the flag pattern the candle should break the top of the cloth to get the tgt. Now it is showing some retracement because of the policy.but it should take support near 5950 --5960. FOR UPPER TGTS lets c. |
c the supp and bounce....wooo... 
|
|
| Back to top |
|
|
saumya12
Brown Belt

Joined: 21 Dec 2011
Posts: 1509
|
| Post: #9 Posted: Fri May 03, 2013 7:59 pm Post subject: |
|
|
Hi Ajeya
Good Pattern
In how much time, the flag pattern is likely to give result.
In one other study the targets are, more or less the same, as given by you.
Thanks
|
|
| Back to top |
|
|
umesh1
Brown Belt
Joined: 24 Nov 2008
Posts: 1974
|
| Post: #10 Posted: Sun May 05, 2013 6:50 am Post subject: Inside Day on RBI policy |
|
|
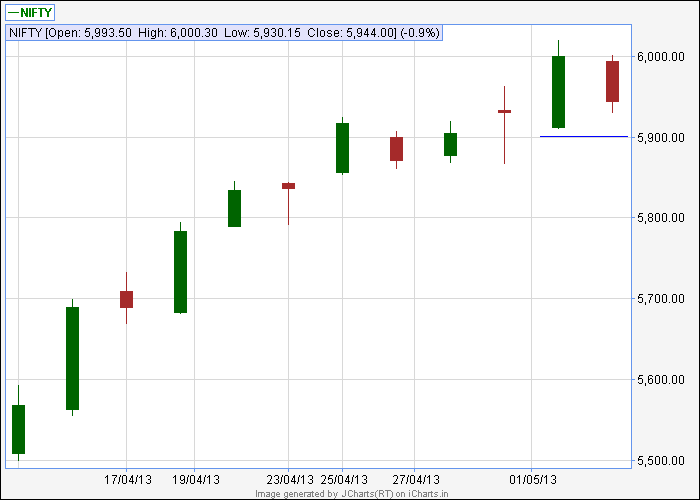
An inside day is often used to signal indecision because neither the bulls nor the bears are able to send the price beyond the range of the previous day. If an inside day is found at the end of a prolonged downtrend and is located near a level of support, it can be used to signal a bullish shift in trend. Conversely, an inside day found near the end of a prolonged uptrend may suggest that the rally is getting exhausted and is likely to reverse.
The next up trend only above 6025,as we had an inside day on an event day(rbi policy)
Cheers Umesh
| Description: |
|
| Filesize: |
7.57 KB |
| Viewed: |
3155 Time(s) |
|
|
|
| Back to top |
|
|
sureenderkalra
White Belt
Joined: 11 Dec 2012
Posts: 174
|
| Post: #11 Posted: Sun May 05, 2013 6:25 pm Post subject: Bullish Flag Patterns |
|
|
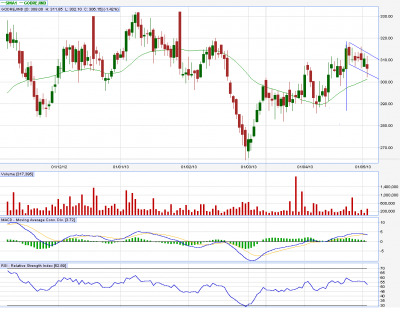
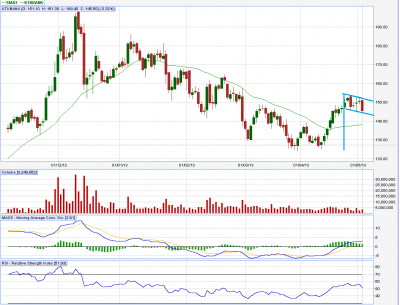
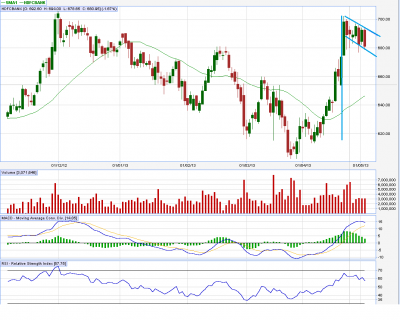
Bullish flag pattern in HDFCbank, GodrejInd, KTKBank and BankIndia. charts of the same are attached and those are self explanatory.
Please comment.

| Description: |
|
| Filesize: |
41.3 KB |
| Viewed: |
690 Time(s) |
|
| Description: |
|
| Filesize: |
47.69 KB |
| Viewed: |
670 Time(s) |
|
| Description: |
|
| Filesize: |
49.59 KB |
| Viewed: |
691 Time(s) |
|
| Description: |
|
| Filesize: |
51.11 KB |
| Viewed: |
671 Time(s) |
|
|
|
| Back to top |
|
|
ajeya12
White Belt
Joined: 30 Oct 2011
Posts: 132
|
| Post: #12 Posted: Tue May 07, 2013 4:09 pm Post subject: |
|
|
| ajeya12 wrote: | | vinay28 wrote: | | apka wrote: | | now that 5970 has come the flag has broken right |
no apka, flag fails below 5930 but target has got reduced now due to fall |
In the flag pattern the candle should break the top of the cloth to get the tgt. Now it is showing some retracement because of the policy.but it should take support near 5950 --5960. FOR UPPER TGTS lets c. |
Dear friends
As mentioned earlier NIFTY has taken support near 5050--5040 range and bounced back now waiting for the tgt hopefully tomorrow .
THANK YOU
ajeya12
| Description: |
|
| Filesize: |
38.39 KB |
| Viewed: |
708 Time(s) |
|
|
|
| Back to top |
|
|
ajeya12
White Belt
Joined: 30 Oct 2011
Posts: 132
|
| Post: #13 Posted: Tue May 07, 2013 5:59 pm Post subject: |
|
|
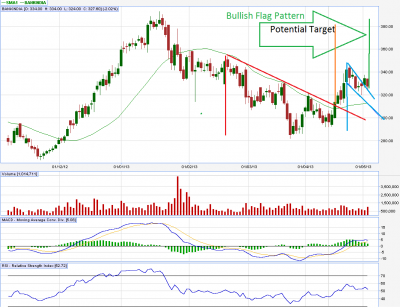
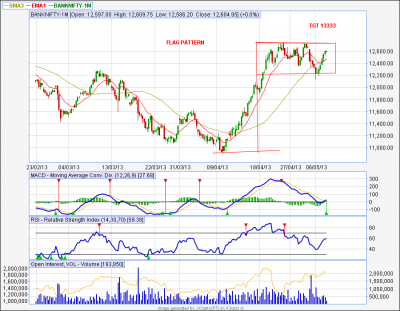
BANK NIFTY IS SHOWING FLAG PATTERN . RIDING FOR HIGHER TGTS . THE TARGET WILL BE 13333.
| Description: |
|
| Filesize: |
48.59 KB |
| Viewed: |
715 Time(s) |
|
|
|
| Back to top |
|
|
ajeya12
White Belt
Joined: 30 Oct 2011
Posts: 132
|
| Post: #14 Posted: Wed May 08, 2013 3:18 pm Post subject: |
|
|
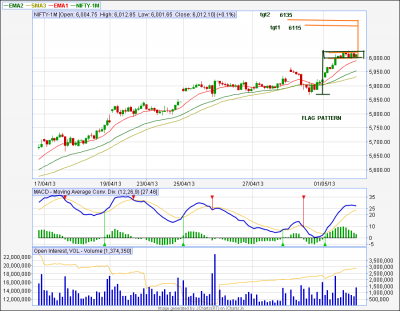
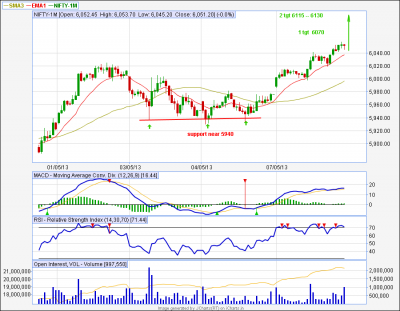
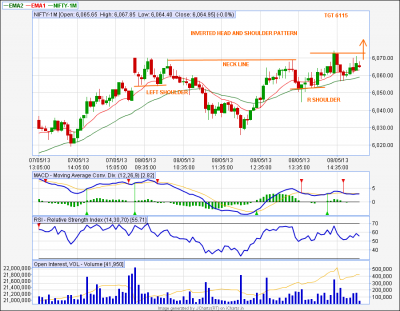
HOW BEAUTIFULLY THE PATTERNS ARE FORMED..... INVERTED HEAD AND SHOULDERS PATTERN....WAITING FOR THE BREAKOUT CANDLE AND THE TGT IS 6115
| Description: |
|
| Filesize: |
42.67 KB |
| Viewed: |
765 Time(s) |
|
|
|
| Back to top |
|
|
ajeya12
White Belt
Joined: 30 Oct 2011
Posts: 132
|
| Post: #15 Posted: Thu May 09, 2013 9:33 am Post subject: |
|
|
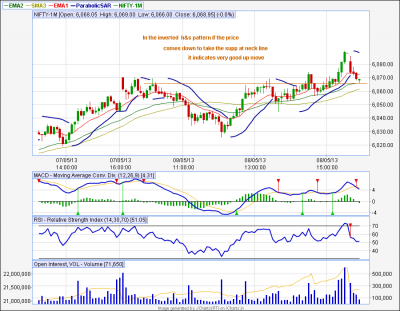
| ajeya12 wrote: | | HOW BEAUTIFULLY THE PATTERNS ARE FORMED..... INVERTED HEAD AND SHOULDERS PATTERN....WAITING FOR THE BREAKOUT CANDLE AND THE TGT IS 6115 |
IF THE BREAK OUT COMES DOWN TO TOUCH THE NECK LINE....THIS INDICATES STRONG SUPP AT THAT LEVEL...IN INVERTED H 7S PATTERN .LETS C
| Description: |
|
| Filesize: |
50.4 KB |
| Viewed: |
708 Time(s) |
|
|
|
| Back to top |
|
|
|