| View previous topic :: View next topic |
| Author |
Pivot Identificatio |
Speculator
Expert

Joined: 15 Apr 2008
Posts: 149
|
Post: #1  Posted: Tue Aug 23, 2011 8:48 am Post subject: Pivot Identificatio Posted: Tue Aug 23, 2011 8:48 am Post subject: Pivot Identificatio |
 |
|
Since it's very hard to locate this info in the main SSPS thread, and the fact that the page number keeps changing, i am placing the Pivot Identification info in this thread.
Pivot Identification
There have been questions by various posters on how to identify pivots. Although it's been explained in my original document clearly, a couple of charts with examples should make this easy subject clear and hopefully no more doubts or questions on this subject. I have also added a link to this page from the SSPS technique thread for future reference.
An uptrend is a series of upswing pivots (USP) and a downtrend is a series of downswing pivots (DSP).
Pivots can form in 2 different ways
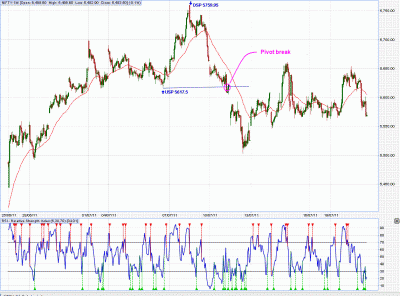
1) When a USP is broken, the prior highest high becomes the new downswing pivot. When a DSP is broken the prior lowest low becomes the new upswing pivot.
Example:
In the chart below (NF_Pivot1.gif) when the USP @ 5617.5 breaks, the trend turns down and the prior highest high which is 5759.95 becomes the new downswing pivot.
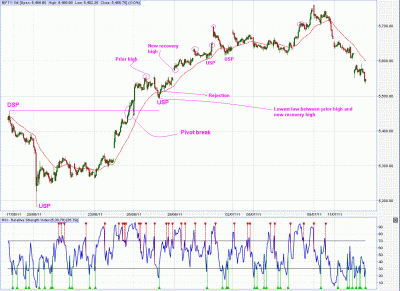
2) When a rejection in an uptrend leads to new recovery highs, the lowest low preceding the rejection becomes the new USP. A much simpler way of identfying the same is to find the lowest point between the prior highs and the new recovery highs.
Similarly, When a rejection in a downtrend leads to new lows, the highest high preceding the rejection becomes the new DSP. A much simpler way of identfying the same is to find the highest point between the prior lows and the new lows.
Example:
In the chart below (NF_Pivot2.gif), after the pivot (DSP) break we start uptrending. Then we get a rejection from the 34 EMA. I have marked the prior high and new recovery high in pink circles. The lowest low point betwen those two circles is the new USP. In this example we get a series of 4 USPs before the trend changes.
Role of RSI(5) in identifying pivots
------------------------------------
We need a valid rejection for pivots to be formed. RSI(5) should be used to resolve the ambiguity about rejections. If a rejection occurs with a touch of the 34 ema then it's a valid rejection and then there is no need to use the RSI(5).
If the rejection occurs by the price coming close to the 34 ema, but not touching it, then check the RSI(5).
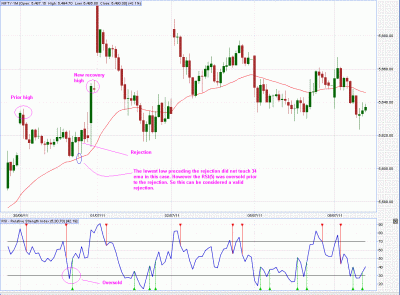
(i) In an uptrend, if the RSI(5) is oversold (below 30) prior to the rejection, then it can be considered a valid rejection
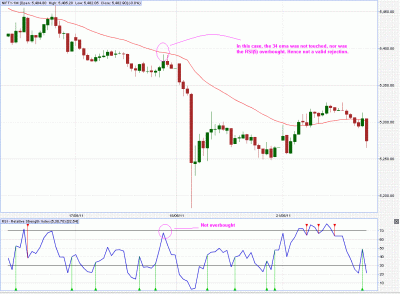
(ii) In a downtrend if the RSI(5) is overbought (above 70) prior to the rejection, then it can be considered a valid rejection.
Examples:
Chart (NF_Pivot3.gif) - 34 EMA not touched, but RSI(5) oversold. Hence, a valid rejection.
Chart (NF_Pivot4.gif) - 34 EMA not touched and RSI(5) not overbought. Hence, not a valid rejection.
- Speculator
| Description: |
|
| Filesize: |
60.84 KB |
| Viewed: |
2441 Time(s) |

|
| Description: |
|
| Filesize: |
57.85 KB |
| Viewed: |
2193 Time(s) |

|
| Description: |
|
| Filesize: |
45.81 KB |
| Viewed: |
1830 Time(s) |

|
| Description: |
|
| Filesize: |
36.07 KB |
| Viewed: |
1752 Time(s) |

|
|
|
| Back to top |
|
 |
|
|  |
kiranlegend
White Belt

Joined: 21 Apr 2011
Posts: 73
|
Post: #2  Posted: Tue Aug 23, 2011 9:23 am Post subject: Posted: Tue Aug 23, 2011 9:23 am Post subject: |
 |
|
| precise and very nice Sir:-) thank you:-)
|
|
| Back to top |
|
 |
|
|
You cannot post new topics in this forum
You cannot reply to topics in this forum
You cannot edit your posts in this forum
You cannot delete your posts in this forum
You cannot vote in polls in this forum
You can attach files in this forum
You can download files in this forum
|
Powered by phpBB © 2001, 2005 phpBB Group
|
|

