| View previous topic :: View next topic |
| Author |
Playing on 34 ema rocks |
dpatodia
White Belt

Joined: 13 Sep 2010
Posts: 1
|
Post: #16  Posted: Thu Sep 30, 2010 7:53 am Post subject: Re: RSI and 34 ema killer combination Posted: Thu Sep 30, 2010 7:53 am Post subject: Re: RSI and 34 ema killer combination |
 |
|
Hello Rocky,
Thank you for shedding light on such a helpful strategy. I've been trying to implement this approach to check it out on a few live cases.
The challenge I faced is to short-list stocks that can be considered as good targets for such a strategy. Here is what I did over the last 3 days:
1. Used Screener (EOD) to short-list stocks using the filter function which identifies companies that have crossed the 34 ema line
RESULT: This revealed a list of about 36 companies.
2. After 2 days, I revisited that list and checked against the charts for the stocks that had held up to the requirement of 3 straight closes above the 34 ema mark.
RESULT: This gave me a shorter list of 29 companies.
The question is that 29 companies short-listed through this process does appear to be a lot for a part-time investor like me, and I am sure many others who have other day-time jobs and are trying to do some intelligent investing on the side.
Can you comment on how to further prune such a list maybe through the use of other filters/criteria, as a 2nd and 3rd step?
Your help is much appreciated.
Regards,
Deven
[quote="rocky1980"]hi traders,
one can analyze the silver chart were the 34 ema works as good support - vice versa the RSI get Over Sold @ 60-50 levels and hovers at 80-60-50 levels this is the magic - if one can get this perfect - huge money waiting ahead (it works for any stock, commodity, forex)
note : - the points are marked in red vertical line for reference
regards
rocky1980[/quote[/u]
|
|
| Back to top |
|
 |
|
|
 |
Allwell
White Belt

Joined: 24 Jan 2010
Posts: 183
|
Post: #17  Posted: Thu Sep 30, 2010 8:43 am Post subject: Re: RSI and 34 ema killer combination Posted: Thu Sep 30, 2010 8:43 am Post subject: Re: RSI and 34 ema killer combination |
 |
|
Sir,
I feel this is very good strategy for investment. Here is my simple quarry.
When one can enter the stock which is trading above 34 day EMA for more more than 3 days for example Petronet is trading above 34EMA for a quite some time and went up to 120 level. Now it is corrected and yesterday's close is around 107.25 level while its 34EMA is around 106.70 level. I feel stock is in uptrend and some times such a stock get support around 34EMA.
can we enter at current level in Petronet or similar pattern stocks.
Please guide.....
Regards
( DIJYYA )
|
|
| Back to top |
|
 |
rocky1980
White Belt

Joined: 12 Jun 2009
Posts: 73
|
Post: #18  Posted: Thu Sep 30, 2010 9:43 am Post subject: 5-13-34 EMA Trading Posted: Thu Sep 30, 2010 9:43 am Post subject: 5-13-34 EMA Trading |
 |
|
hi traders,
please find the attachment below - this would give clear idea of trading on 5-13-34 ema- entry and exit rules - profit booking rules mentioned in this document -
this strategy was posted buy jo.jo. on this forum
please download the attchment
| Description: |
|

Download |
| Filename: |
fractal_trading_system_196 (1).doc |
| Filesize: |
163 KB |
| Downloaded: |
954 Time(s) |
|
|
| Back to top |
|
 |
ragarwal
Yellow Belt

Joined: 16 Nov 2008
Posts: 582
|
Post: #19  Posted: Fri Oct 08, 2010 12:47 pm Post subject: Posted: Fri Oct 08, 2010 12:47 pm Post subject: |
 |
|
dear rocky,according to this strategy can v buy sasken if it closes over 195.5 today as this is the 34dema.it has been closing above this level fr the last two days.plz reply.
regds rashmi
|
|
| Back to top |
|
 |
rocky1980
White Belt

Joined: 12 Jun 2009
Posts: 73
|
Post: #20  Posted: Sat Oct 09, 2010 2:41 pm Post subject: Sasken Posted: Sat Oct 09, 2010 2:41 pm Post subject: Sasken |
 |
|
Hi, trader
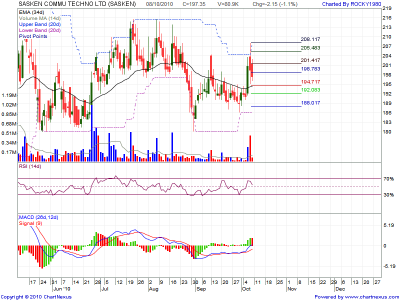
Looking at sasken chart on EOD one can easily spot that this stock is in sideways trend - so even close above 34 ema wont help - as no specific trend recognition done yet -
for reference the chart is attached below
Please pick the stocks which in good trend - negative or positive - sideways trending or consolidation should be avoided.
34 EMA strategy :
1) bullish security : buy on dips around 34 ema- in uptrend wait for the pull back @ 34 ema then only buy
2) bearish security : short on high around 34 ema - in downtrend wait for pull back and short at that point
Most Important : Please view multiple time frame chart to find entry and exit on 34 ema support and resistance - do not short or buy blindly.
atleast put on 1 or 2 indicator for correct entry and exit - no single reliance on 34 EMA -
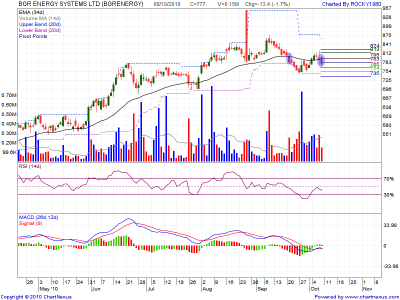
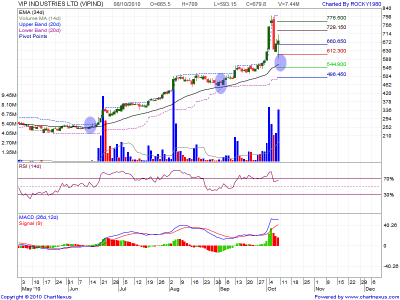
On this note i would like to add that Please do TREND analysis 1st and then Plot Technicals that would help to get good returns.
some examples are attached below for reference
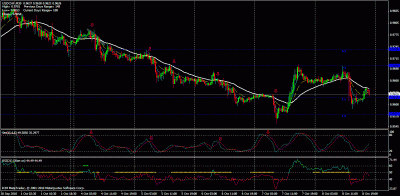
One can use Stoc - 15,6,6 on any time frame for perfect entry and exit - for reference please watch USD/CHF Chart
Chart 1 - Sasken - Sideways
Chart 2 - VIP Ind. - Uptrend
Chart 3 - BGR Energy - Down trend
Chart 4 - USD/CHF- Strong Down Trend - perfect bearsh - good trades
thanks
regards
rocky1980
| Description: |
| USD/CHF - perfect bearish - example this is 30 min chart |
|
| Filesize: |
33.2 KB |
| Viewed: |
610 Time(s) |
|
| Description: |
|
| Filesize: |
42.1 KB |
| Viewed: |
616 Time(s) |
|
| Description: |
|
| Filesize: |
42.2 KB |
| Viewed: |
604 Time(s) |
|
| Description: |
|
| Filesize: |
45.03 KB |
| Viewed: |
600 Time(s) |
|
Last edited by rocky1980 on Sun Oct 10, 2010 11:29 am; edited 2 times in total |
|
| Back to top |
|
 |
bharatsabharwal
White Belt

Joined: 27 Jun 2010
Posts: 9
|
Post: #21  Posted: Sat Oct 09, 2010 6:08 pm Post subject: Can I buy DLF Posted: Sat Oct 09, 2010 6:08 pm Post subject: Can I buy DLF |
 |
|
Dear rocky
I'm new to stock market by going through your 34 ema study I am very much impressed. kindly guide me can I buy DLF on 30 min chart it just crossed 34ema. I want to attach chart but fail. kindly do me a favour by giving your views. size=18][/size]
|
|
| Back to top |
|
 |
rocky1980
White Belt

Joined: 12 Jun 2009
Posts: 73
|
Post: #22  Posted: Sat Oct 09, 2010 10:01 pm Post subject: Re: Can I buy DLF Posted: Sat Oct 09, 2010 10:01 pm Post subject: Re: Can I buy DLF |
 |
|
| bharatsabharwal wrote: | Dear rocky
I'm new to stock market by going through your 34 ema study I am very much impressed. kindly guide me can I buy DLF on 30 min chart it just crossed 34ema. I want to attach chart but fail. kindly do me a favour by giving your views. size=18][/size] |
Dear Trader
Please follow the past trend and watch the EOD chart of DLF and then on Intraday chart - of 5 - 15 - 30 min. to enter - best is to watch 5 min chart and enter on stock with noticing prior support and resistance level of yesterdays charts. please check the forum post - PRICE AND ACTION on this site to enter with coinciding 34 ema close - i bet you wont get wrong entry - and please use some lower indicator for reference - with 2 or more confirmations - execute trades with strict stop losses.
happy trading
thanks
regards
rocky1980

|
|
| Back to top |
|
 |
chetan83
Brown Belt

Joined: 19 Feb 2010
Posts: 2037
|
Post: #23  Posted: Sun Oct 10, 2010 12:14 am Post subject: GOT STUCK IN RMSEEDJPR SHORT Posted: Sun Oct 10, 2010 12:14 am Post subject: GOT STUCK IN RMSEEDJPR SHORT |
 |
|
Hi Rocky,
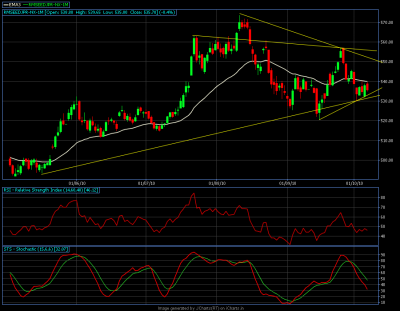
I have been following up your strategy for few days, BUT I got stuck in one Agri Commodity today. I had created short position in Rape Seed at 532 on 04-10-10 at around below the 34 EMA, thing was working fine, until today i.e, on 06-10-10, there was a sudden jump in Rape seed by almost 18 ruppes in the opening session, so could not place the SL order.
I have attached the EOD and 60Mins chart of RMSEED for Oct expiry. Pls put some light as what can I do in coming week, I am in a deep MTM loss. Should I average or square off in Loss on Monday at any mentioned price.
Pls Help.
| Description: |
|

Download |
| Filename: |
RMSEEDJPR - DAILY.doc |
| Filesize: |
141.5 KB |
| Downloaded: |
485 Time(s) |
| Description: |
|

Download |
| Filename: |
RMSEEDJPR - 60MINS.doc |
| Filesize: |
152.5 KB |
| Downloaded: |
487 Time(s) |
|
|
| Back to top |
|
 |
rocky1980
White Belt

Joined: 12 Jun 2009
Posts: 73
|
Post: #24  Posted: Sun Oct 10, 2010 11:11 am Post subject: Re: GOT STUCK IN RMSEEDJPR SHORT Posted: Sun Oct 10, 2010 11:11 am Post subject: Re: GOT STUCK IN RMSEEDJPR SHORT |
 |
|
| chetan83 wrote: | Hi Rocky,
I have been following up your strategy for few days, BUT I got stuck in one Agri Commodity today. I had created short position in Rape Seed at 532 on 04-10-10 at around below the 34 EMA, thing was working fine, until today i.e, on 06-10-10, there was a sudden jump in Rape seed by almost 18 ruppes in the opening session, so could not place the SL order.
I have attached the EOD and 60Mins chart of RMSEED for Oct expiry. Pls put some light as what can I do in coming week, I am in a deep MTM loss. Should I average or square off in Loss on Monday at any mentioned price.
Pls Help. |
Dear Trader,
I can understand that you are struck in a very odd situation with this trade - this sudden spike may be due to some fundamental news developed - as we all know commodity market is driven by major supply and demand force - the only thing u can do is put sl above 555 - as its is creating lower top - lower bottom - now f it breaks 558 and close above this level - new top is expected or it will move down again - and the on the date you have shorted - it has created an HAMMER - so its obvious the buying pressure was developer and it moved sideways for 3 days and then spiked off n 06 oct. now wait and watch for the close.
Traders are requested to apply trend lines and lower indicators to coincide with the 34 ema trades - please do not short or buy on reliability of ANY SINGLE INDICATOR OR MOVING AVERAGES.
regards
rocky1980
| Description: |
|
| Filesize: |
44.48 KB |
| Viewed: |
545 Time(s) |
|
|
|
| Back to top |
|
 |
ragarwal
Yellow Belt

Joined: 16 Nov 2008
Posts: 582
|
Post: #25  Posted: Sun Oct 10, 2010 11:53 am Post subject: Posted: Sun Oct 10, 2010 11:53 am Post subject: |
 |
|
dear rocky,thnx fr rplying to my query,i hv taken positions in gmdc and gspl based according to the 34 dema theory.the stocks did move up but then receded a bit.the rsi is nt in d over bought zone and d macd has turned positiv for both.wat shud i do.
regds rashmi
|
|
| Back to top |
|
 |
bharatsabharwal
White Belt

Joined: 27 Jun 2010
Posts: 9
|
Post: #26  Posted: Sun Oct 10, 2010 12:22 pm Post subject: Thanks for reply Posted: Sun Oct 10, 2010 12:22 pm Post subject: Thanks for reply |
 |
|
Dear Rocky
Thanks for your valuable advice can you provide the post as advised by you
( please check the forum post - PRICE AND ACTION on this site to enter with coinciding 34 ema close )
Kindly do me a favour by provide the above post.
Thanks
Bharat
|
|
| Back to top |
|
 |
rocky1980
White Belt

Joined: 12 Jun 2009
Posts: 73
|
Post: #27  Posted: Sun Oct 10, 2010 9:01 pm Post subject: Re: Thanks for reply Posted: Sun Oct 10, 2010 9:01 pm Post subject: Re: Thanks for reply |
 |
|
| bharatsabharwal wrote: | Dear Rocky
Thanks for your valuable advice can you provide the post as advised by you
( please check the forum post - PRICE AND ACTION on this site to enter with coinciding 34 ema close )
Kindly do me a favour by provide the above post.
Thanks
Bharat |
TRADING THE PRICE:
Some common methods i follow during intraday trades, i will be posting it here.. to begin with a few set of rules.
1) If price is above open price, then my main trades will be long. I may take quick short trades at resistances, but they will be fast, with strict SL of around 15 points and quick targets too of 10-20 points.
2) The reverse holds for Price below Open price.
3) Getting IN: Try to get in as near as possible to the open price with Low or 15 points SL whichever is higher. Same holds when u are trying a short.
4) Once the price moves 15-20 points above Open Price, move ur SL to Open price or ur Buy Price.
5) Booking: Usually look for STs level to book profits.. and if they are clubbed with Pivots Classic, more chances of Nifty stopping or reversing from that point.
6) Use of TLs help in booking profits like shown in the charts today.
Todays Trade.. A Good entry today @ lowest possible tradable value was between 4320-4223 with the low 4305 as SL. Once it moved away from the Open price i moved the SL to open price 4315 ( use a bit tolerance as sometimes it hits n returns) Today the first booking was done when the TL & LOC were breached around 12.45. A neat trade of 30-35 points to begin with. Could have tried a quick short also here, but avoided... Well i was rather waiting for it to break open price so that i could enter a better short.
Next trade i preffered getting in again @ breach of downward TL and LOC.. ( always remember, we didnt breach the Open price even once, so i was interested only in long trades, my main trades would be all long)
A general observation when Nifty acummulates for some time around one of STs levels and when it starts moving after that, Nifty will skip the next level and jump to the next level... For eg: in todays trade, it accumulated in and around LOC for queit sometime and when it began rising, it discarded BULL level and jumped to R-1/R-2..
Note: this holds true only when the levels are not wide apart.. Yesterday the difference between Bull n Bear was 100 points and Nifty respected each n every level. Today Bull n Bear were only 60 points apart and Bull level wasnt respected..
The reason why i am writing this here so that when u find such things happening, u dont make the mistake of booking at Bull level, rather u can smartly use ur trailing SL to grasp the full range.
No doubts today 2 trades gave a clean 100 points...|xx
this was posted by JIMMIE on this forum under market direction category - more can be found out in that section - please find out
regards
rocky1980
| Description: |
|
| Filesize: |
11.05 KB |
| Viewed: |
2576 Time(s) |

|
|
|
| Back to top |
|
 |
rocky1980
White Belt

Joined: 12 Jun 2009
Posts: 73
|
Post: #28  Posted: Sun Oct 10, 2010 9:07 pm Post subject: Re: Thanks for reply Posted: Sun Oct 10, 2010 9:07 pm Post subject: Re: Thanks for reply |
 |
|
| bharatsabharwal wrote: | Dear Rocky
Thanks for your valuable advice can you provide the post as advised by you
( please check the forum post - PRICE AND ACTION on this site to enter with coinciding 34 ema close )
Kindly do me a favour by provide the above post.
Thanks
Bharat |
please specify entry levels and use fibbo. to find out support ress levels - please use combination of trendline - fibbo - indicators and enter - the stocks u have mentioned are in correction mode and not that high beta - stock so one can exit with 7-10% profit ratio and with 1.5% sl of buying price.
regards
rocky1980
|
|
| Back to top |
|
 |
hedger
White Belt

Joined: 07 Oct 2010
Posts: 71
|
Post: #29  Posted: Tue Oct 12, 2010 11:00 pm Post subject: Posted: Tue Oct 12, 2010 11:00 pm Post subject: |
 |
|
Hi Rocky,
Pls help me out in the trade, in which I have stuck since last 4 days, and as u have helped earlier in my short Oct RMSEED at 533, there was sudden spurt in price on saturday which made a high of 555, currentlu trading at 548. Pls guide whether to role over my short position in next month NOV, sqaure off, or Buy it now. Attached are daily charts, including todays closing.
Feedback awaited eagerly, as I will be o/s starting tomorrow afternoon.,
Rgrds,
Hedger.
| Description: |
|

Download |
| Filename: |
RMSEED - 20OCT.doc |
| Filesize: |
148 KB |
| Downloaded: |
502 Time(s) |
| Description: |
|

Download |
| Filename: |
RMSEED 19NOV.doc |
| Filesize: |
147 KB |
| Downloaded: |
461 Time(s) |
|
|
| Back to top |
|
 |
drsureshbs
White Belt

Joined: 22 Oct 2008
Posts: 58
|
Post: #30  Posted: Wed Oct 13, 2010 12:56 am Post subject: Posted: Wed Oct 13, 2010 12:56 am Post subject: |
 |
|
DEAR ROCKY
vERY MUCH APPRICATE UR EFFORTS TO EDUCATE OTHERS
CAN U PL throw some tight on entry based on 34ema ,treandline and fibb with a chart. It will b usefull to many
Thank you
|
|
| Back to top |
|
 |
|

