| View previous topic :: View next topic |
| Author |
Playing on 34 ema rocks |
rocky1980
White Belt

Joined: 12 Jun 2009
Posts: 73
|
Post: #1  Posted: Sun Sep 26, 2010 12:06 pm Post subject: Playing on 34 ema rocks Posted: Sun Sep 26, 2010 12:06 pm Post subject: Playing on 34 ema rocks |
 |
|
Hi traders,
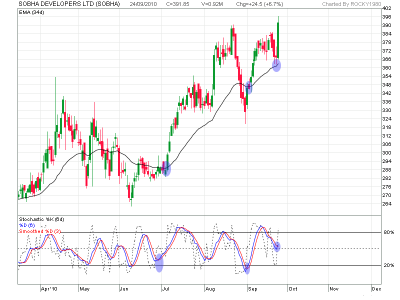
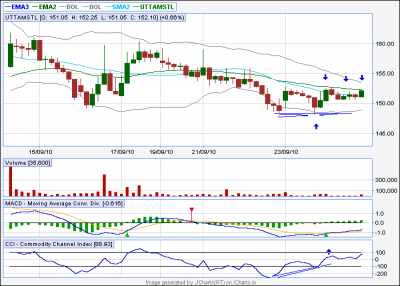
some months ago jo.jo mentioned the fractrals trading on this forum with the combination of 5-13-34 ema -i found it the best interpretation so far i really thanks for that, bcoz that have changed my trading ideas upside down - a bit modification from my side i have come up with some simple but very powerful trading method by just plotting 34 ema on any time frame that to for any stock, commodity or forex charts.
(for more on 5-13-34 ema please refer jo.jo post)
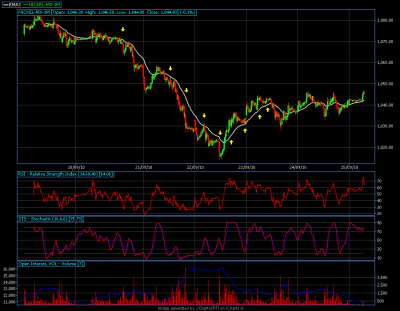
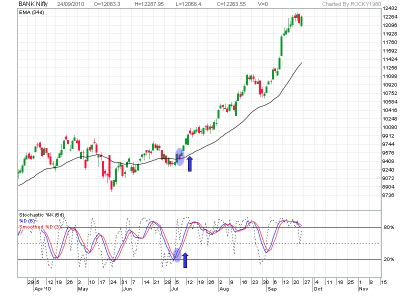
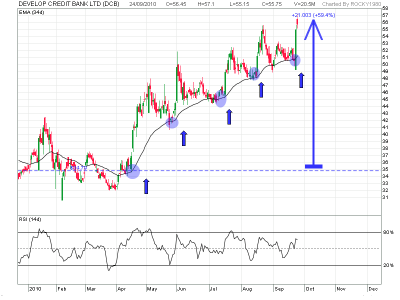
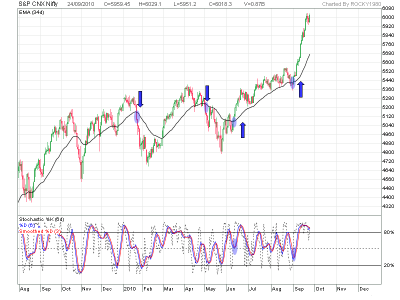
the setup consit 34 ema additional one can add stochastic of 6,6,3 or RSI and trade on swing (any time frame)
some sample charts are attached below for study
thumb rule
long position on 3 close above 34 ema - no shorting unless 3 close below 34 ema -
book profit when stoc 6,6,3 get OB
if any one has more input on this please share : ideas welcome
enjoy profits - keep simple charting and earn money
regards
rocky190
| Description: |
| nickel on 10 min live below 34 ema gave almost 40 odd rs. |
|
| Filesize: |
49.11 KB |
| Viewed: |
1031 Time(s) |
|
| Description: |
| bank nifty just shot up 9400 to 12500 - just track the trend of 34 ema even on intraday it works best |
|
| Filesize: |
55.67 KB |
| Viewed: |
861 Time(s) |
|
| Description: |
| development credit bank gave lot of swing opportunity and min 19% return on the stock |
|
| Filesize: |
48.86 KB |
| Viewed: |
713 Time(s) |
|
| Description: |
|
| Filesize: |
69.51 KB |
| Viewed: |
643 Time(s) |
|
| Description: |
| sobha developer recent trades |
|
| Filesize: |
53.66 KB |
| Viewed: |
605 Time(s) |
|
|
|
| Back to top |
|
 |
|
|
 |
ragarwal
Yellow Belt

Joined: 16 Nov 2008
Posts: 582
|
Post: #2  Posted: Sun Sep 26, 2010 1:22 pm Post subject: Posted: Sun Sep 26, 2010 1:22 pm Post subject: |
 |
|
dear rocky,
could you plz elaborate how to follow this ule,i hv not been able to follow it .regds rashmi
|
|
| Back to top |
|
 |
knraoram
White Belt

Joined: 16 May 2010
Posts: 1
|
Post: #3  Posted: Sun Sep 26, 2010 2:51 pm Post subject: Posted: Sun Sep 26, 2010 2:51 pm Post subject: |
 |
|
| Dear Rocky ji, I am new to this forum and beginner of trading. your article is very useful for people like me . i have one query that what is `long position on 3 close' what is meant by 3close. pl. elobrate thanx
|
|
| Back to top |
|
 |
rocky1980
White Belt

Joined: 12 Jun 2009
Posts: 73
|
Post: #4  Posted: Sun Sep 26, 2010 8:00 pm Post subject: 3 close Posted: Sun Sep 26, 2010 8:00 pm Post subject: 3 close |
 |
|
hi traders,
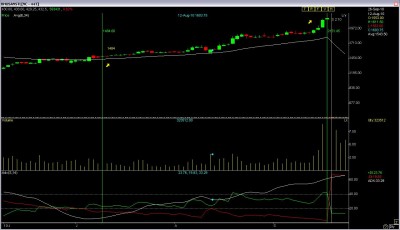
long position above 3 close - means 3 days close above the 34 ema one can enter buy on 4th day close and put stoploss of day before yesterday low price and hold for minimum 8 % to 15 % profit target and keep stoploss of 2% of the yesterdays low or the buy price - whichever is suitable or the leverage of trader. (all trades on EOD basis)
rashmi u can follow this rule to enter the trade on EOD basis.
chek out bhushan steel best example before the split the long was initiated @ 1480 levels and went upto 2151 in 45 days or so ..
simple entry rules and profit unlimited and stoploss 2% acceptable - just you need to hold the stock and not panic - once you buy the shut the pc and check on eod - sure returns
regards
rocky1980
| Description: |
| bhushan from 1484 - to 2151 |
|
| Filesize: |
96.94 KB |
| Viewed: |
605 Time(s) |
|
|
|
| Back to top |
|
 |
gama04
White Belt

Joined: 11 Jan 2010
Posts: 4
|
Post: #5  Posted: Sun Sep 26, 2010 10:24 pm Post subject: Posted: Sun Sep 26, 2010 10:24 pm Post subject: |
 |
|
| rocky sir on rsi secret topic can u please explain me narrow range.
|
|
| Back to top |
|
 |
popoy
White Belt

Joined: 18 Sep 2010
Posts: 18
|
Post: #6  Posted: Mon Sep 27, 2010 7:41 am Post subject: Re: Playing on 34 ema rocks Posted: Mon Sep 27, 2010 7:41 am Post subject: Re: Playing on 34 ema rocks |
 |
|
| rocky1980 wrote: | Hi traders,
some months ago jo.jo mentioned the fractrals trading on this forum with the combination of 5-13-34 ema -i found it the best interpretation so far i really thanks for that, bcoz that have changed my trading ideas upside down - a bit modification from my side i have come up with some simple but very powerful trading method by just plotting 34 ema on any time frame that to for any stock, commodity or forex charts.
(for more on 5-13-34 ema please refer jo.jo post)
the setup consit 34 ema additional one can add stochastic of 6,6,3 or RSI and trade on swing (any time frame)
some sample charts are attached below for study
thumb rule
long position on 3 close above 34 ema - no shorting unless 3 close below 34 ema -
book profit when stoc 6,6,3 get OB
if any one has more input on this please share : ideas welcome
enjoy profits - keep simple charting and earn money
regards
rocky190 |
| Description: |
| 34 ema acts as resisatance i hourly charts |
|
| Filesize: |
12.27 KB |
| Viewed: |
571 Time(s) |
|
|
|
| Back to top |
|
 |
rocky1980
White Belt

Joined: 12 Jun 2009
Posts: 73
|
Post: #7  Posted: Mon Sep 27, 2010 9:42 pm Post subject: another beauty trade of atlanta Posted: Mon Sep 27, 2010 9:42 pm Post subject: another beauty trade of atlanta |
 |
|
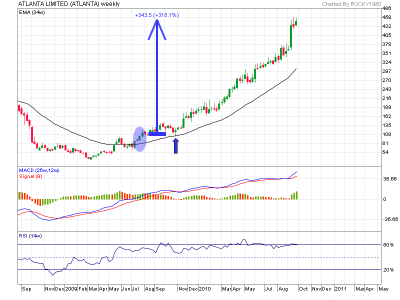
just watch the magic of 34 ema in atlanta - from 108 to 463 - still no sign to square off the trades (time frame aug. 2009 to sept 2010) - investors earn - traders die - this is the proof - hold
regards
rocky1980
| Description: |
|
| Filesize: |
49.89 KB |
| Viewed: |
624 Time(s) |
|
|
|
| Back to top |
|
 |
marthandan
White Belt

Joined: 14 Jan 2007
Posts: 26
|
|
| Back to top |
|
 |
marthandan
White Belt

Joined: 14 Jan 2007
Posts: 26
|
Post: #9  Posted: Tue Sep 28, 2010 8:05 am Post subject: Posted: Tue Sep 28, 2010 8:05 am Post subject: |
 |
|
This method of using ema in trading was suggested earlier by my net friend Mr.Vasu from Bangalore. He had taken pains to explain the method both in the forum and sb .I am sure people who followed would have gained immencely.
marthandan
|
|
| Back to top |
|
 |
tnandkumar
White Belt

Joined: 04 Jan 2010
Posts: 19
|
Post: #10  Posted: Tue Sep 28, 2010 9:33 am Post subject: Posted: Tue Sep 28, 2010 9:33 am Post subject: |
 |
|
hi rocky sir,thank u very much for disclosing such a simple and sucessfull strategy.i have few questions,if u find time pls reply sir
1. can we use it for commodity intraday trading on 15 min charts
2.is it tht we have to see only 34 ema or we can use any one supporting indicators (stoch,macd or rsi) to enter the trade.
3.can we use this system for commoditiy to take positions.
|
|
| Back to top |
|
 |
venkkatshiv
White Belt

Joined: 16 May 2008
Posts: 90
|
Post: #11  Posted: Tue Sep 28, 2010 10:20 am Post subject: Re: Playing on 34 ema rocks Posted: Tue Sep 28, 2010 10:20 am Post subject: Re: Playing on 34 ema rocks |
 |
|
| popoy wrote: | | rocky1980 wrote: | Hi traders,
some months ago jo.jo mentioned the fractrals trading on this forum with the combination of 5-13-34 ema -i found it the best interpretation so far i really thanks for that, bcoz that have changed my trading ideas upside down - a bit modification from my side i have come up with some simple but very powerful trading method by just plotting 34 ema on any time frame that to for any stock, commodity or forex charts.
(for more on 5-13-34 ema please refer jo.jo post)
the setup consit 34 ema additional one can add stochastic of 6,6,3 or RSI and trade on swing (any time frame)
some sample charts are attached below for study
thumb rule
long position on 3 close above 34 ema - no shorting unless 3 close below 34 ema -
book profit when stoc 6,6,3 get OB
if any one has more input on this please share : ideas welcome
enjoy profits - keep simple charting and earn money
regards
rocky190 |
|
|
|
| Back to top |
|
 |
ragarwal
Yellow Belt

Joined: 16 Nov 2008
Posts: 582
|
Post: #12  Posted: Tue Sep 28, 2010 11:40 am Post subject: Posted: Tue Sep 28, 2010 11:40 am Post subject: |
 |
|
thanku rocky sir,one more request fr d 34 dema v hv to see the charts on a 3 month time frame or more.and stochastics,do we hav to use the slow stocastics or the fast one.plz reply.i think a recent example of 34 dema crossover is jswholdings.from 1830 [thats d 34 dema ,roughly]the stock went upto 2200 plus.please correct me if i am wrong.cadilla too has made the 34 dema crossover,can i enter d stock now or is it too late.thnx once again.
rashmi
|
|
| Back to top |
|
 |
ragarwal
Yellow Belt

Joined: 16 Nov 2008
Posts: 582
|
Post: #13  Posted: Tue Sep 28, 2010 12:03 pm Post subject: Posted: Tue Sep 28, 2010 12:03 pm Post subject: |
 |
|
dear rocky sir,i hv found out that bajaj hindustan has crossed 34ema at 123 and kamat hotels if closes over 120.8 wil b gud to buy.am i right.
rashmi
|
|
| Back to top |
|
 |
rocky1980
White Belt

Joined: 12 Jun 2009
Posts: 73
|
Post: #14  Posted: Tue Sep 28, 2010 1:56 pm Post subject: Trading nifty on 34 ema Posted: Tue Sep 28, 2010 1:56 pm Post subject: Trading nifty on 34 ema |
 |
|
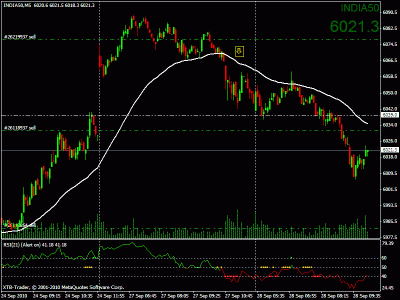
Hi traders,
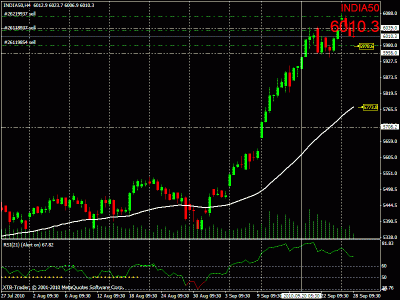
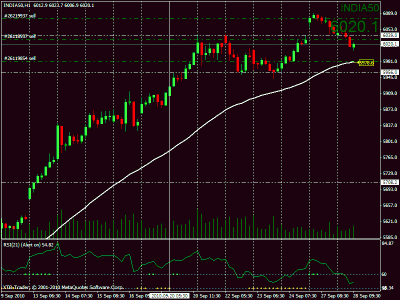
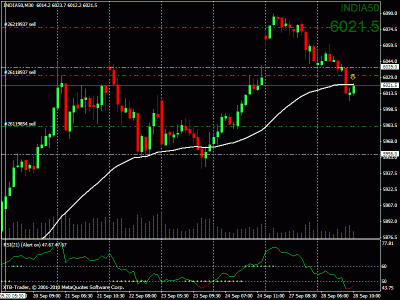
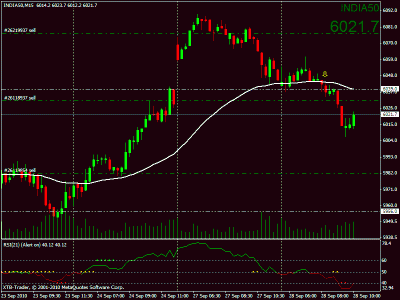
the strategy to use for intra-day trades with 34 ema is
1) plot 34 ema on intra-day charts and plot simple support - resistance lines along with pivot - again u can refer the post on the ichart forum - price and action - posted way back - keep simple charting - enter short on 2 close below 34 ema and book profit at s1-s2 levels - for long trades vice-versa - remember on intra-day if the stock trades above day pivot do not short wait for the direction - one can use stochastic 6,6,3 on 15 min chart for trades entry and exit - simple.
2) for longer time frames one actually we need not to plot any major indicator bcoz the longer the time frame the indicator wont signal that quick - its used for trend recognition only - (time frame : weekly-monthly-yearly) almost all indicator wont have that fierce moves on these time frames - best to use moving averages and support - resistance zones to enter in any trades for longer time frames (please combine all time frames and enter into the trades - 5,15,30,1H,4H and get the right entry
for sample i am attaching the nifty chart of 5 min - 15 min - 30 min
this show different time frame crossover of price below 34 ema
according to this position one can short on 5 min chart cross over and watch on 15 min chart for support of 34 ema and can book profit there
then if cross 15min chart of 34 ema then take again position and book at 30 min chart suppport - one can trail the stops according to this along with different time frame views - this is current day chart for nifty -
the last chart is 60 min chart and 34 ema support is @ 5978 - (future price not spot) one can just c this level come if nifty cracks more .
even on H4 - 4 hour chart the nifty could reach @ 5773
and more add to this is most of fibb levels converge at this all 34 ema price supports - just check it out
you can practice and execute trades later on - the best way to do
regards
| Description: |
|
| Filesize: |
21.88 KB |
| Viewed: |
726 Time(s) |
|
| Description: |
|
| Filesize: |
23.61 KB |
| Viewed: |
574 Time(s) |
|
| Description: |
|
| Filesize: |
21.86 KB |
| Viewed: |
600 Time(s) |
|
| Description: |
|
| Filesize: |
18.95 KB |
| Viewed: |
572 Time(s) |
|
| Description: |
|
| Filesize: |
20.87 KB |
| Viewed: |
628 Time(s) |
|
|
|
| Back to top |
|
 |
rocky1980
White Belt

Joined: 12 Jun 2009
Posts: 73
|
Post: #15  Posted: Wed Sep 29, 2010 10:12 pm Post subject: RSI and 34 ema killer combination Posted: Wed Sep 29, 2010 10:12 pm Post subject: RSI and 34 ema killer combination |
 |
|
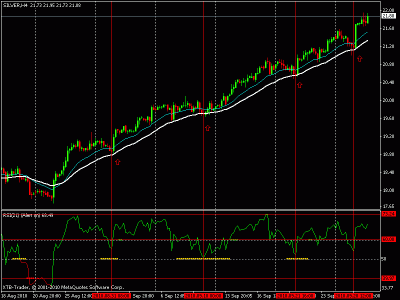
hi traders,
one can analyze the silver chart were the 34 ema works as good support - vice versa the RSI get Over Sold @ 60-50 levels and hovers at 80-60-50 levels this is the magic - if one can get this perfect - huge money waiting ahead (it works for any stock, commodity, forex)
note : - the points are marked in red vertical line for reference
regards
rocky1980
| Description: |
|
| Filesize: |
17.74 KB |
| Viewed: |
668 Time(s) |
|
|
|
| Back to top |
|
 |
|

