| View previous topic :: View next topic |
| Author |
POINT N FIGURE CHART UPDATED. 02.00PM 11-11-11 |
Padkondu
White Belt

Joined: 23 Jan 2008
Posts: 120
|
Post: #1  Posted: Fri Nov 11, 2011 2:31 pm Post subject: POINT N FIGURE CHART UPDATED. 02.00PM 11-11-11 Posted: Fri Nov 11, 2011 2:31 pm Post subject: POINT N FIGURE CHART UPDATED. 02.00PM 11-11-11 |
 |
|
| Point and figure chart now updated at 02.00pm 11-11-11
|
|
| Back to top |
|
 |
|
|
|
vinst
Black Belt

Joined: 09 Jan 2007
Posts: 3303
|
| Post: #2 Posted: Fri Nov 11, 2011 8:01 pm Post subject: Re: POINT N FIGURE CHART UPDATED. 02.00PM 11-11-11 |
|
|
| Padkondu wrote: | | Point and figure chart now updated at 02.00pm 11-11-11 |
where's the chart pls?
|
|
| Back to top |
|
|
Padkondu
White Belt
Joined: 23 Jan 2008
Posts: 120
|
| Post: #3 Posted: Sat Nov 12, 2011 10:00 am Post subject: Re: POINT N FIGURE CHART UPDATED. 02.00PM 11-11-11 |
|
|
| vinst wrote: | | Padkondu wrote: | | Point and figure chart now updated at 02.00pm 11-11-11 |
where's the chart pls? |
Sorry vinst, actually i was posting the chart in another thread and i accidentally posted this as a new thread. how ever i will continue this thread for this and shall try to post some important stocks as well. also i would like to post some important information about point and figure charts and trading techniques using point and figure charts. only constraint is time. so i am limited to box reversal 1precent 3-box size for positional trades and swing trades with larger objectives
for now i am limited to nifty-spot.
regards
padkondu
| Description: |
| BOX SIZE=50 POINTS, 3BOX REVERSAL |
|

Download |
| Filename: |
PnF Chart NF.xls |
| Filesize: |
31 KB |
| Downloaded: |
792 Time(s) |
Last edited by Padkondu on Wed Nov 16, 2011 8:56 am; edited 2 times in total |
|
| Back to top |
|
|
vinst
Black Belt
Joined: 09 Jan 2007
Posts: 3303
|
| Post: #4 Posted: Sat Nov 12, 2011 10:05 am Post subject: Re: POINT N FIGURE CHART UPDATED. 02.00PM 11-11-11 |
|
|
| Padkondu wrote: | | vinst wrote: | | Padkondu wrote: | | Point and figure chart now updated at 02.00pm 11-11-11 |
where's the chart pls? |
Sorry vinst, actually i was posting the chart in another thread and i accidentally posted this as a new thread. how ever i will continue this thread for this and shall try to post some important stocks as well. also i would like to post some important information about point and figure charts and trading techniques using point and figure charts. only constraint is time. so i am limited to box reversal 1precent 3-box size for positional trades and swing trades with larger objectives
for now i am limited to nifty-spot.
regards
padkondu |
Hello padkondu,
thanks for the chart. pls give the link for other thread, your chart can be followed there itself.
|
|
| Back to top |
|
|
Padkondu
White Belt
Joined: 23 Jan 2008
Posts: 120
|
| Post: #5 Posted: Sat Nov 12, 2011 7:12 pm Post subject: Re: POINT N FIGURE CHART UPDATED. 02.00PM 11-11-11 |
|
|
| vinst wrote: | | Padkondu wrote: | | vinst wrote: | | Padkondu wrote: | | Point and figure chart now updated at 02.00pm 11-11-11 |
where's the chart pls? |
Sorry vinst, actually i was posting the chart in another thread and i accidentally posted this as a new thread. how ever i will continue this thread for this and shall try to post some important stocks as well. also i would like to post some important information about point and figure charts and trading techniques using point and figure charts. only constraint is time. so i am limited to box reversal 1precent 3-box size for positional trades and swing trades with larger objectives
for now i am limited to nifty-spot.
regards
padkondu |
Hello padkondu,
thanks for the chart. pls give the link for other thread, your chart can be followed there itself. |
Hi vinst
pl donot bother about the other link, i will continue to post the chart here, since the title of that link is totally irrelevant.
however i give the link here
http://www.icharts.in/forum/trading-education-for-the-newbees-experts-pl-help-t2778.html
regards
padkondu
|
|
| Back to top |
|
|
MILANCHN
White Belt
Joined: 12 Mar 2009
Posts: 105
|
| Post: #6 Posted: Sat Nov 12, 2011 8:45 pm Post subject: padkondu |
|
|
| culd u pls explain breifly how to read the chart
|
|
| Back to top |
|
|
Padkondu
White Belt
Joined: 23 Jan 2008
Posts: 120
|
| Post: #7 Posted: Mon Nov 14, 2011 9:27 am Post subject: Re: padkondu |
|
|
| MILANCHN wrote: | | culd u pls explain breifly how to read the chart |
Hi Milanchn
that is the actual idea. I actually wanted to give a briefing about these charts this weekend. but i had struck up with an issue. an important relative of mine adkitted in hospital with cardiac problem. but i will do it as soon as possible. but lot of information is available on web.
i will give some basic idea of how therse charts are made and what is the importance of these charts.
each of the boxes in the chart is called a "Box". the size of the box means a certain portion of value of the stock, which is optional. the general size of Box is 1.5, 1.0, 0.5 percent of the stock price at some level around which the stock oscillates over larger period of time. here in our case of nifty 5000 value is taken as a pivot value for nifty and 0.1 percent of this is taken as the box size. 1.5 percent is chosen to eliminate the minor movements which is called "noise" of the stocks within this portion. so in the current chart the box size is 50 and the multiples of the box size are kept on the left hand size column. values such as 5000,5050,6000,6050,....
this becomes the first parameter of this chart.
next, an up move is indicated by "X" and a down move indicated by "O". let us suppose the nifty is moving in up direction, we keep putting "X" for each box if the value of the box is completely reached. for example nifty is moving up currently at 5200 and we put "X" in the upper corresponding box only after nifty moves >= 5250. we put another X above this box vertically up after nifty reaches or crosses 5300 and so on. Same is the case with "O" when nifty is moving down ward. Now comes the topic of second parameter of "reversal" or when do we switch from X to O, i.e., an up move to down move? this is again an optional basing on our requirement and objectives. the general method is box reversal. so now the in our example nifty is moving up and reached 5300 but failed to cross 5350 the no filling of boxes until the nifty goes down by 3 boxes, i.e. 150 points so now we have a column of "X" vertically upward, reached 5300 and then nifty goes down by 5350-150 = 5200 or below. then we start a fresh column of "O" from top leaving the one top box besides the top "X" till 5200. now we have a fresh column/candle of "O" s and then continue till a reversal above 150 points occur when we agani start a fresh column/candle of "X"s. why 150 point? because we have chosen the method of 3-box reversal as our parameter. people with short objectives may choose 1- box reversal of 2-box revrsal, depending up on their choice. most popular are 1-box reversal for shorter objectives and 3-box reversal for the larger objective. that is how this chart is prepared.
the advantage of this chart is the "elimination of time parameter in the chart" and "elimination of noise of the market, or the insignificant small moves". so just by looking at the chart we can see how the market moves. suppose the market keeps moving in a very small magnitude for several days, and thereby we neither put "X" in the same column/candle, nor we put "O" in the consequent/next column. so no change in the chart. this the factor of "time" is eliminated from the chart.
the other aspects of 1. support/resistance, 2. trend identification/trend lines and 2. continuation/reversal patterns for entry/exit will be posted later.
i actually do not trade this. but this chart gives me a great cue about market, the birds-eye view. just look at the eod candlestick chart for one year and this Point and figure chart. you can understand how important is this to have a borader view of the market.
while the usual charts and indicators we speak are lagging, this is a leading indicator of the market like fibonacci.
if anyone is interested in preparing the chart for swing trade, one may stick to the same box size, 1.e., 50, or 25, but 1-box reversal parameters and post in the same thread. such chart prepared for swing trading gives a very good idea for day trading. i used to prepare this chart when i was day trading with box size of 25 points and 3-box reversal method. which was of great help. sometimes i spotted reversals and entered very perfectly and gone against the trend though my usul system suggests a long.
i will try to keep posting about this, but only constraint is time. i have very less time for trading/tech analysis becuase of my job/other financial activities.
regards
Padkondu
|
|
| Back to top |
|
|
Padkondu
White Belt
Joined: 23 Jan 2008
Posts: 120
|
| Post: #8 Posted: Wed Nov 16, 2011 3:15 pm Post subject: Point and figure chart updated at 03.00 pm 16/11/2011 |
|
|
dear friends
here are two point and figure charts
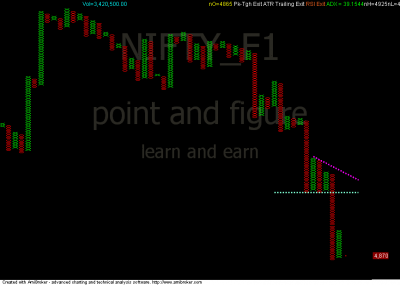
1. nifty-spot 50 point - 3box reversal for positional trades
2. nifty- near month futures - 25 point 3-box reversal for swing trades.
please correct me if i am wrong.
regards
Padkondu
| Description: |
| 25POINT 3BOX REVERSAL NIFTY FUTS |
|
Download |
| Filename: |
PnF Chart NF 25.xls |
| Filesize: |
56.5 KB |
| Downloaded: |
638 Time(s) |
| Description: |
|
Download |
| Filename: |
PnF Chart NS 50.xls |
| Filesize: |
35.5 KB |
| Downloaded: |
721 Time(s) |
|
|
| Back to top |
|
|
sherbaaz
Yellow Belt

Joined: 27 May 2009
Posts: 543
|
| Post: #9 Posted: Wed Nov 16, 2011 4:36 pm Post subject: Re: Point and figure chart updated at 03.00 pm 16/11/2011 |
|
|
| Padkondu wrote: | dear friends
here are two point and figure charts
1. nifty-spot 50 point - 3box reversal for positional trades
2. nifty- near month futures - 25 point 3-box reversal for swing trades.
please correct me if i am wrong.
regards
Padkondu |
hi,
have u drawn the chart using closing price or high/low price? kindly clarify
regds,
|
|
| Back to top |
|
|
Padkondu
White Belt
Joined: 23 Jan 2008
Posts: 120
|
| Post: #10 Posted: Wed Nov 16, 2011 5:17 pm Post subject: Re: Point and figure chart updated at 03.00 pm 16/11/2011 |
|
|
| sherbaaz wrote: | | Padkondu wrote: | dear friends
here are two point and figure charts
1. nifty-spot 50 point - 3box reversal for positional trades
2. nifty- near month futures - 25 point 3-box reversal for swing trades.
please correct me if i am wrong.
regards
Padkondu |
hi,
have u drawn the chart using closing price or high/low price? kindly clarify
regds, |
Hi
the chart is drawn using mere price/tick price irrespective of closing/high/low of candles.
padkondu
|
|
| Back to top |
|
|
sherbaaz
Yellow Belt
Joined: 27 May 2009
Posts: 543
|
| Post: #11 Posted: Wed Nov 16, 2011 6:11 pm Post subject: Re: Point and figure chart updated at 03.00 pm 16/11/2011 |
|
|
| Padkondu wrote: | | sherbaaz wrote: | | Padkondu wrote: | dear friends
here are two point and figure charts
1. nifty-spot 50 point - 3box reversal for positional trades
2. nifty- near month futures - 25 point 3-box reversal for swing trades.
please correct me if i am wrong.
regards
Padkondu |
hi,
have u drawn the chart using closing price or high/low price? kindly clarify
regds, |
Hi
the chart is drawn using mere price/tick price irrespective of closing/high/low of candles.
padkondu |
Hi,
I am not talking about candle high low and all. In 60 min tf you cannot have tick data or price.
Either you are using line chart value which is close only or any other chart or from terminal. Kindly clarify as there are couple of ways to draw pnf
regds,
|
|
| Back to top |
|
|
Padkondu
White Belt
Joined: 23 Jan 2008
Posts: 120
|
| Post: #12 Posted: Wed Nov 16, 2011 11:29 pm Post subject: Re: Point and figure chart updated at 03.00 pm 16/11/2011 |
|
|
| sherbaaz wrote: | | Padkondu wrote: | | sherbaaz wrote: | | Padkondu wrote: | dear friends
here are two point and figure charts
1. nifty-spot 50 point - 3box reversal for positional trades
2. nifty- near month futures - 25 point 3-box reversal for swing trades.
please correct me if i am wrong.
regards
Padkondu |
hi,
have u drawn the chart using closing price or high/low price? kindly clarify
regds, |
Hi
the chart is drawn using mere price/tick price irrespective of closing/high/low of candles.
padkondu |
Hi,
I am not talking about candle high low and all. In 60 min tf you cannot have tick data or price.
Either you are using line chart value which is close only or any other chart or from terminal. Kindly clarify as there are couple of ways to draw pnf
regds, |
Hi Sherbaaz, I actually watch dly,60 min and 20 min charts as part of usual trading strategy. for updating these point and figure charts i depend on 20 min charts.
the for filling the boxes i just look for movement of price.
suppose i have a series of X moving in up direction and to continue to fill the next box i look at high of the candle.
for example nifty is moving up, i.e., currently we are having a column of X building up, and currently at 5150, then one of the following will happen.
case a. in the direction of current up move i watch high of each candle and fill 5200-box with X if high of a candle meets/exceeds 5200
case b. or otherwise again suppose nifty is at 5150 and in the opposite direction, i.e., for a new column of Os to form, we need a downward movement by 3 boxes size for which i look at the lows of the candles
so 5150-150=5000. then i keep watching the lows of the candle meeting/crossing 5000 down side. then i begin the fresh column of Os.
then what if in a single 20 min candle with a high above 5200 and a low below 5000? if that is your question, then i go with 5 min chart for that particular period to know which happened first.. but that did not happen for the last 90 days.
so i depend on highs and low of candles and choose to continue a column or to begin a new column in the opposite direction. i think i could expalin. pl let me know if i am wrong.
regards
Padkondu
|
|
| Back to top |
|
|
Padkondu
White Belt
Joined: 23 Jan 2008
Posts: 120
|
| Post: #13 Posted: Fri Nov 18, 2011 3:47 pm Post subject: Re: Point and figure chart updated at 03.30 pm 18/11/2011 |
|
|
Dear all
the point and figure charts updated.
Sherbaaz
I hv been looking for your reply.
regards
Padkondu
| Description: |
| 50point 3boxreversal Nifty Spot |
|
Download |
| Filename: |
PnF Chart NS 50.xls |
| Filesize: |
36 KB |
| Downloaded: |
747 Time(s) |
| Description: |
| 25point 3boxreversal Nifty futures |
|
Download |
| Filename: |
PnF Chart NF 25.xls |
| Filesize: |
56.5 KB |
| Downloaded: |
633 Time(s) |
|
|
| Back to top |
|
|
mahson
White Belt
Joined: 08 Aug 2009
Posts: 80
|
|
| Back to top |
|
|
sherbaaz
Yellow Belt
Joined: 27 May 2009
Posts: 543
|
| Post: #15 Posted: Sun Nov 20, 2011 10:43 am Post subject: Re: Point and figure chart updated at 03.30 pm 18/11/2011 |
|
|
| Padkondu wrote: | Dear all
the point and figure charts updated.
Sherbaaz
I hv been looking for your reply.
regards
Padkondu |
Hi,
I got my answer you are using High/Low to construct pnf chart.
thanks
|
|
| Back to top |
|
|
|