|
|
| View previous topic :: View next topic |
| Author |
Pop Gun Pattern |
s.muthuswamy
White Belt

Joined: 15 Jun 2008
Posts: 96
|
Post: #1  Posted: Sat Aug 20, 2011 9:26 pm Post subject: Pop Gun Pattern Posted: Sat Aug 20, 2011 9:26 pm Post subject: Pop Gun Pattern |
 |
|
This is a three bar pattern composed of an outside bar preceded by an inside bar. In other words , the middle bar is completely sandwiched between the extremes. Such a pattern introduces swift tradable moves in price. More importantly, once the move ends, it is significantly retraced just as the pop gun cork going out and back. It has been noticed that this pattern tends to occur prior to impulsive waves.
A number of stocks and indices have shown such pattern in their charts during the recent times. For example , NF , BN , LIC HF , L&T , PNB and Rel. Capital .
These have exhibited pop gun pattern on the days 21.6.11, 22 and 23 , have respectively risen from 5336,10611,223.2,1677,1046 , 523.6 and fallen to 4951,9940,244.8,1164,1035,377.1
Renuka Sugars shows a pop gun pattern on the days 5.5.11, 6 and 9. On 10.5.11 it falls from 69.35 to 56 on 26.5.11. Then it rises from 56.1 on 27.5.11 to 76.35 on 8.7.11
Look at Escorts on 28.4.11 , 29 and 2.5.11 . It falls continuously from 141.1. Again it has shown a pop gun on 16.8.11,17 and 18. Will it rise to 141 very soon?
The prices shown here are for Futures.
Let us see.
|
|
| Back to top |
|
 |
|
| |
amitkbaid1008
Yellow Belt

Joined: 04 Mar 2009
Posts: 540
|
| Post: #2 Posted: Sat Aug 20, 2011 9:33 pm Post subject: Re: Pop Gun Pattern |
|
|
| s.muthuswamy wrote: | This is a three bar pattern composed of an outside bar preceded by an inside bar. In other words , the middle bar is completely sandwiched between the extremes. Such a pattern introduces swift tradable moves in price. More importantly, once the move ends, it is significantly retraced just as the pop gun cork going out and back. It has been noticed that this pattern tends to occur prior to impulsive waves.
A number of stocks and indices have shown such pattern in their charts during the recent times. For example , NF , BN , LIC HF , L&T , PNB and Rel. Capital .
These have exhibited pop gun pattern on the days 21.6.11, 22 and 23 , have respectively risen from 5336,10611,223.2,1677,1046 , 523.6 and fallen to 4951,9940,244.8,1164,1035,377.1
Renuka Sugars shows a pop gun pattern on the days 5.5.11, 6 and 9. On 10.5.11 it falls from 69.35 to 56 on 26.5.11. Then it rises from 56.1 on 27.5.11 to 76.35 on 8.7.11
Look at Escorts on 28.4.11 , 29 and 2.5.11 . It falls continuously from 141.1. Again it has shown a pop gun on 16.8.11,17 and 18. Will it rise to 141 very soon?
The prices shown here are for Futures.
Let us see. |
Dear Muthuswamy
Better if you explain this in objective way with the help of chart
|
|
| Back to top |
|
|
s.muthuswamy
White Belt
Joined: 15 Jun 2008
Posts: 96
|
| Post: #3 Posted: Sun Aug 21, 2011 1:31 pm Post subject: Re: Pop Gun Pattern |
|
|
| amitkbaid1008 wrote: | | s.muthuswamy wrote: | This is a three bar pattern composed of an outside bar preceded by an inside bar. In other words , the middle bar is completely sandwiched between the extremes. Such a pattern introduces swift tradable moves in price. More importantly, once the move ends, it is significantly retraced just as the pop gun cork going out and back. It has been noticed that this pattern tends to occur prior to impulsive waves.
A number of stocks and indices have shown such pattern in their charts during the recent times. For example , NF , BN , LIC HF , L&T , PNB and Rel. Capital .
These have exhibited pop gun pattern on the days 21.6.11, 22 and 23 , have respectively risen from 5336,10611,223.2,1677,1046 , 523.6 and fallen to 4951,9940,244.8,1164,1035,377.1
Renuka Sugars shows a pop gun pattern on the days 5.5.11, 6 and 9. On 10.5.11 it falls from 69.35 to 56 on 26.5.11. Then it rises from 56.1 on 27.5.11 to 76.35 on 8.7.11
Look at Escorts on 28.4.11 , 29 and 2.5.11 . It falls continuously from 141.1. Again it has shown a pop gun on 16.8.11,17 and 18. Will it rise to 141 very soon?
The prices shown here are for Futures.
Let us see. |
Dear Muthuswamy
Better if you explain this in objective way with the help of chart |
Very simple pattern is this Pop gun pattern. Here , of the three days , the second day candle should lie within the ranges of the other two days.
If this pattern occurs after a prolonged uptrend, once the price breaks down the low of the third day, go SHORT with SL above the high of this candle. If it occurs after a downtrend, go LONG once the price crosses the high of the third day with SL below the low of this candle.
No particular chart needed to explain this concept.
|
|
| Back to top |
|
|
chandrujimrc
Brown Belt

Joined: 21 Apr 2009
Posts: 1683
|
| Post: #4 Posted: Sun Aug 21, 2011 1:49 pm Post subject: Pop Gun pattern |
|
|
Dear Muthusamy,
Thanks for your explanation.How to decide the target?
Chandru.
|
|
| Back to top |
|
|
maooliservice
White Belt
Joined: 04 Aug 2010
Posts: 93
|
| Post: #5 Posted: Sun Aug 21, 2011 6:24 pm Post subject: |
|
|
Dear sir
Is this strategy workable for intraday also
Regards
Mohan
|
|
| Back to top |
|
|
solanki
White Belt
Joined: 12 Feb 2007
Posts: 155
|
| Post: #6 Posted: Sun Aug 21, 2011 6:50 pm Post subject: Re: Pop Gun Pattern |
|
|
[quote="s.muthuswamy"]This is a three bar pattern composed of an outside bar preceded by an inside bar. In other words , the middle bar is completely sandwiched between the extremes. Such a pattern introduces swift tradable moves in price. More importantly, once the move ends, it is significantly retraced just as the pop gun cork going out and back. It has been noticed that this pattern tends to occur prior to impulsive waves.
A number of stocks and indices have shown such pattern in their charts during the recent times. For example , NF , BN , LIC HF , L&T , PNB and Rel. Capital .
These have exhibited pop gun pattern on the days 21.6.11, 22 and 23 , have respectively risen from 5336,10611,223.2,1677,1046 , 523.6 and fallen to 4951,9940,244.8,1164,1035,377.1
Renuka Sugars shows a pop gun pattern on the days 5.5.11, 6 and 9. On 10.5.11 it falls from 69.35 to 56 on 26.5.11. Then it rises from 56.1 on 27.5.11 to 76.35 on 8.7.11
Look at Escorts on 28.4.11 , 29 and 2.5.11 . It falls continuously from 141.1. Again it has shown a pop gun on 16.8.11,17 and 18. Will it rise to 141 very soon?
The prices shown here are for Futures.
sir ji n e idea abut escorts charts daily and weekly
Last edited by solanki on Mon Nov 28, 2011 8:54 pm; edited 1 time in total |
|
| Back to top |
|
|
jjm
White Belt
Joined: 17 Mar 2010
Posts: 411
|
| Post: #7 Posted: Sun Aug 21, 2011 10:54 pm Post subject: |
|
|
Dear All
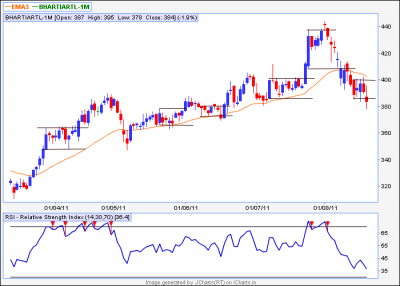
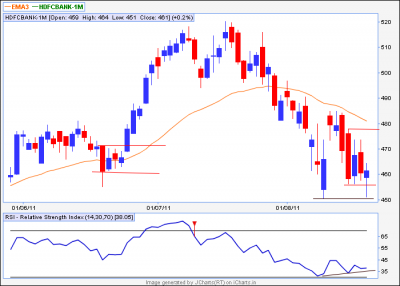
Earlier trade based on this pattern marked in chart...RSI + ve div
Same is also seen in Bharti..that stock is periodically forming this pattern
In case of bharti it has given BD
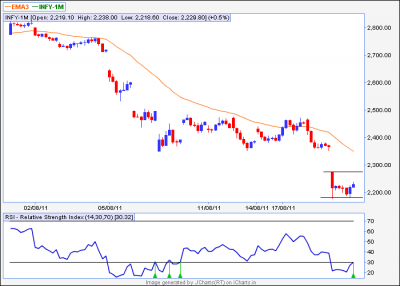
Another stock that can be watched is Infy hrly..all Narrow range bars

JJM
| Description: |
|
| Filesize: |
25.46 KB |
| Viewed: |
900 Time(s) |
|
| Description: |
|
| Filesize: |
21.32 KB |
| Viewed: |
716 Time(s) |
|
| Description: |
|
| Filesize: |
24.26 KB |
| Viewed: |
719 Time(s) |
|
|
|
| Back to top |
|
|
s.muthuswamy
White Belt
Joined: 15 Jun 2008
Posts: 96
|
| Post: #8 Posted: Mon Aug 22, 2011 2:08 am Post subject: Pop Gun Pattern |
|
|
It seems the pop gun pattern has not been properly conveyed by me.
This is a three candle pattern representing three periods. Of these the second is inside the range of the first and the third is an outside candle for the second.
|
|
| Back to top |
|
|
s.muthuswamy
White Belt
Joined: 15 Jun 2008
Posts: 96
|
| Post: #9 Posted: Mon Nov 28, 2011 7:12 pm Post subject: Pop gun pattern |
|
|
What is special about the pop gun pattern?
It introduces swift,tradable moves in price. Once the moves end, they are significantly retraced, just like the pop gun going out and coming back.
I was ashtonished to look at the monthly chart of NF from its historic low of 2228 in Oct 2008. The candles of NF for Oct, Nov and Dec 2008 form a "Double inside bar " set up indicating a possible recovery from this low.
Then the next 3 monthly candles corresponding to Jan,Feb and Mar 2009 form a pop gun. From then on , NF rises continuously upto 6349 in Nov 2010(and then begins to fall).
Usially the retracement happens upto 50% - 100% and sometimes more.
When this materialises, where will NF end up?
I am freightened.
The top 3 candles corresponding to Nov,Dec 2010 and Jan 2011
also form a pop gun.
|
|
| Back to top |
|
|
gokulc
White Belt
Joined: 19 May 2008
Posts: 28
|
| Post: #10 Posted: Mon Nov 28, 2011 8:16 pm Post subject: Re: Pop gun pattern |
|
|
| s.muthuswamy wrote: | What is special about the pop gun pattern?
It introduces swift,tradable moves in price. Once the moves end, they are significantly retraced, just like the pop gun going out and coming back.
I was ashtonished to look at the monthly chart of NF from its historic low of 2228 in Oct 2008. The candles of NF for Oct, Nov and Dec 2008 form a "Double inside bar " set up indicating a possible recovery from this low.
Then the next 3 monthly candles corresponding to Jan,Feb and Mar 2009 form a pop gun. From then on , NF rises continuously upto 6349 in Nov 2010(and then begins to fall).
Usially the retracement happens upto 50% - 100% and sometimes more.
When this materialises, where will NF end up?
I am freightened.
The top 3 candles corresponding to Nov,Dec 2010 and Jan 2011
also form a pop gun. |
Of the last few monthly candles, Aug 2011, Sep 2011 and Oct 2011 also form a 'pop gun'. Does this mean the market will reverse from the fall?
|
|
| Back to top |
|
|
s.muthuswamy
White Belt
Joined: 15 Jun 2008
Posts: 96
|
| Post: #11 Posted: Tue Nov 29, 2011 4:40 pm Post subject: Pop gun pattern |
|
|
Mr.Gokul
Look into the following which will tell you what you asked in your previous post:
Scrip Pop gun candle Date
NF 23.6.11 Rises from 5336(24.6.11) to 5752(7.7.11)
Falls from 5760(8.7.11) to 5115(5.8.11)
Bank Nifty 23.6.11 Rises from 10611(24.6.11) 11495(7.7.11)
Falls from 11490(8.7.11) to 9940(9.8.11)
DLF 10.6.11 Falls from 232.6(13.6.11) to 206.4(23.6.11)
Rises from 211.3(24.6.11) to 241(8.7.11)
HDIL 23.5.11 Rises from 151.5(25.5.11) to 181.2(7.6.11)
Falls from 179.7(8.6.11) to 148.3 (23.6.11)
This is only a sample.
|
|
| Back to top |
|
|
gokulc
White Belt
Joined: 19 May 2008
Posts: 28
|
| Post: #12 Posted: Tue Nov 29, 2011 7:38 pm Post subject: Re: Pop gun pattern |
|
|
| s.muthuswamy wrote: | Mr.Gokul
Look into the following which will tell you what you asked in your previous post:
Scrip Pop gun candle Date
NF 23.6.11 Rises from 5336(24.6.11) to 5752(7.7.11)
Falls from 5760(8.7.11) to 5115(5.8.11)
Bank Nifty 23.6.11 Rises from 10611(24.6.11) 11495(7.7.11)
Falls from 11490(8.7.11) to 9940(9.8.11)
DLF 10.6.11 Falls from 232.6(13.6.11) to 206.4(23.6.11)
Rises from 211.3(24.6.11) to 241(8.7.11)
HDIL 23.5.11 Rises from 151.5(25.5.11) to 181.2(7.6.11)
Falls from 179.7(8.6.11) to 148.3 (23.6.11)
This is only a sample. |
Mr. S. Muthuswamy
Thank you for the reply.
I am just learning and trying to understand. My questions are simple. Let me rephrase it.
1. Is there a 'pop gun' pattern in Nifty's Aug, Sep and Oct 2011 monthly candles? I wanted to know if my understanding of the pattern is correct.
2. Since Nifty has been falling since Jan 2011 and then sideways (in monthly charts), does the appearance of a 'pop gun' pattern here signify an reversal of direction?
I am just trying to understand the pattern and not use it for predicting anything here.
Thank you,
-- Gokul
|
|
| Back to top |
|
|
s.muthuswamy
White Belt
Joined: 15 Jun 2008
Posts: 96
|
| Post: #13 Posted: Tue Nov 29, 2011 9:08 pm Post subject: Pop gun pattern |
|
|
Mr.Gokul,
Your observation that the monthly candles of NF for Aug, Sep, Oct 2011 form a pop gun is correct.
The rally after the Mar2009 pop gun ends with another pop gun by the monthly candles for Nov, Dec 2010 and Jan2011.
Let us see how the recovery is going to be.
S.Muthuswamy.
|
|
| Back to top |
|
|
s.muthuswamy
White Belt
Joined: 15 Jun 2008
Posts: 96
|
| Post: #14 Posted: Sun Feb 12, 2012 5:34 pm Post subject: Pop gun pattern |
|
|
On 9-1-12 , a no. of indices and scrips formed pop gun pattern and the following are some:
NF, BN , Allahabad bank, Axis bank
Dena bank, DLF ,Escorts, HDFC bank, HDIL ,Hindalco
ICICI , JSW steel, Kotak bank, LIC, LT
PNB, Rcom, Rel.capital, Sesagoa, Tata steel.
All these are rising from that day onwards.
The last time NF made a pop gun pattern was on 23.6.11 and the next day onwards NF rose from 5336 to 5752(7.7.11). The reversal started on 8.7.11 and the fall was from 5760 to 5115(5.8.11) which is more than 100% of the rise.
Let us see how much is NF going to fall this time.
Last edited by s.muthuswamy on Sun Feb 12, 2012 8:04 pm; edited 1 time in total |
|
| Back to top |
|
|
pkholla
Black Belt

Joined: 04 Nov 2010
Posts: 2890
|
| Post: #15 Posted: Sun Feb 12, 2012 5:47 pm Post subject: |
|
|
s.muthuswamy: please clarify. your definition of Pop Gun is big candle, small engulfed candle, big candle OK?
the web article of EWI shows coffee chart with 2 candle Pop Gun with small candle 1st and big engulfing candle next.
Is 2 candle pop gun also valid from your research and knowledge?
Rgds, prakash holla
|
|
| Back to top |
|
|
|
|
You cannot post new topics in this forum
You cannot reply to topics in this forum
You cannot edit your posts in this forum
You cannot delete your posts in this forum
You cannot vote in polls in this forum
You can attach files in this forum
You can download files in this forum
|
Powered by phpBB © 2001, 2005 phpBB Group
|
|
|


