| View previous topic :: View next topic |
| Author |
Positional / Swing Views. |
hemant.icharts
Site Admin
Joined: 10 May 2011
Posts: 334
|
Post: #16  Posted: Fri May 23, 2014 12:30 pm Post subject: Posted: Fri May 23, 2014 12:30 pm Post subject: |
 |
|
Something about commodities now.
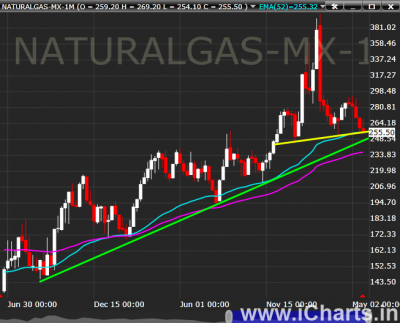
Natural Gas:
It has formed a Head and Shoulder top on weekly chart, close to the neckline. May give a break down below neckline today.
It is taking support at 52 week EMA. It is close to 50% retracement of the move which is at 250. It may be bearish now after winter has ended in western countries.
Bearish Support Levels for Natural Gas below weekly close of 244 are 234 -- 228 -- 213 -- 189 -- 145. Pattern may fail after weekly close above 289.
| Description: |
|
| Filesize: |
1.32 MB |
| Viewed: |
576 Time(s) |
|
|
|
| Back to top |
|
 |
|
|
|
hemant.icharts
Site Admin
Joined: 10 May 2011
Posts: 334
|
| Post: #17 Posted: Fri May 30, 2014 1:15 pm Post subject: |
|
|
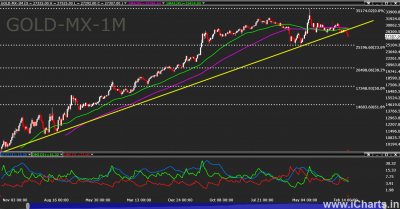
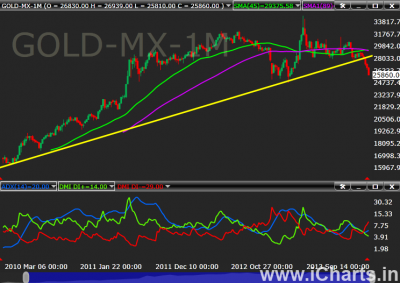
Gold has turned downwards, it can be mere retracement or a start of bearish journey for gold.
Support Levels for GOLD : 26010 -- 24000 -- 19500.
| Description: |
|
| Filesize: |
3.66 MB |
| Viewed: |
607 Time(s) |
|
|
|
| Back to top |
|
|
hemant.icharts
Site Admin
Joined: 10 May 2011
Posts: 334
|
| Post: #18 Posted: Fri May 30, 2014 1:25 pm Post subject: |
|
|
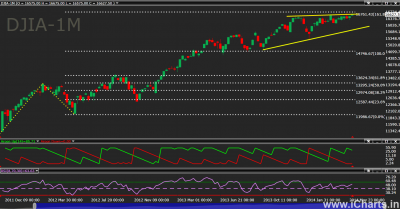
Something about a global index now:
Dow Jones Industrial Average is showing strenght on bullish side. It has given a breakout of an ascending triangle on a weekly chart.
Fibonacci extension of of 161.8% is a resistance now.
Oscillators showing strength on bullish side, Aroon upside is above 75 level and down side is at zero and RSI is maintaining above 50 level..
Long above weekly close of 16762 with stop loss below 15321 and targets of 17255 -- 18362 -- 19362 -- 20205.
| Description: |
|
| Filesize: |
3.66 MB |
| Viewed: |
618 Time(s) |
|
|
|
| Back to top |
|
|
hemant.icharts
Site Admin
Joined: 10 May 2011
Posts: 334
|
| Post: #19 Posted: Fri May 30, 2014 4:34 pm Post subject: |
|
|
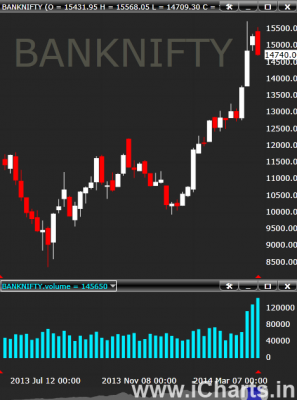
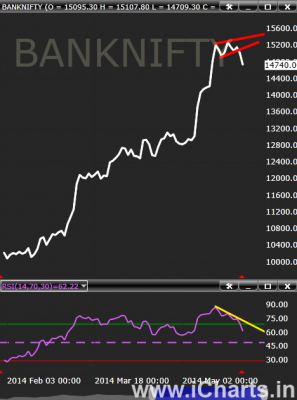
Banknifty gave a Bearish Engulfing on Weekly chart.
RSI giving Negative divergence on DAILY charts, will there be retracement now lets us monitor.
Expect levels to come on downside 14434 -- 13750 -- 13113.
| Description: |
|
| Filesize: |
1.13 MB |
| Viewed: |
583 Time(s) |
|
| Description: |
|
| Filesize: |
1.13 MB |
| Viewed: |
642 Time(s) |
|
|
|
| Back to top |
|
|
hemant.icharts
Site Admin
Joined: 10 May 2011
Posts: 334
|
| Post: #20 Posted: Wed Jun 04, 2014 9:46 am Post subject: |
|
|
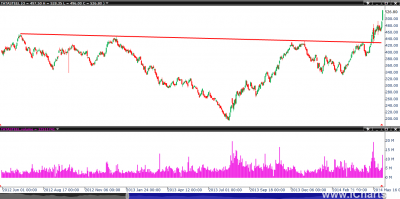
TATASTEEL:
No big explanation on this charts. It is straight forward, tata steel has head and shoulders bottom and gave breakout is with good volumes
Upside targets 600 -- (789 to 850) -- 1255
| Description: |
|
| Filesize: |
3.39 MB |
| Viewed: |
613 Time(s) |
|
|
|
| Back to top |
|
|
hemant.icharts
Site Admin
Joined: 10 May 2011
Posts: 334
|
| Post: #21 Posted: Wed Jun 04, 2014 11:04 am Post subject: |
|
|
| hemant.icharts wrote: | Gold has turned downwards, it can be mere retracement or a start of bearish journey for gold.
Support Levels for GOLD : 26010 -- 24000 -- 19500. |
Baby Steps now on downward journey.
This weekly close below 25721 will take to 24900 then 24000 -- 23155
| Description: |
|
| Filesize: |
1.49 MB |
| Viewed: |
636 Time(s) |
|
|
|
| Back to top |
|
|
hemant.icharts
Site Admin
Joined: 10 May 2011
Posts: 334
|
| Post: #22 Posted: Wed Jun 11, 2014 9:43 am Post subject: |
|
|
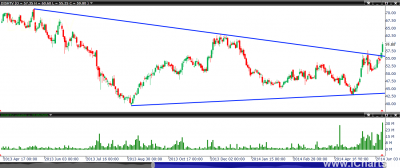
DISHTV gave breakout of triangle with flying color that is with good volume.
No more explanation required
Buy DISHTV above daily close of 62.15 with stop loss of daily close below 50 and targets of 69 -- 80 -- 94.
| Description: |
|
| Filesize: |
2.95 MB |
| Viewed: |
559 Time(s) |
|
|
|
| Back to top |
|
|
hemant.icharts
Site Admin
Joined: 10 May 2011
Posts: 334
|
| Post: #23 Posted: Wed Jun 11, 2014 1:45 pm Post subject: |
|
|
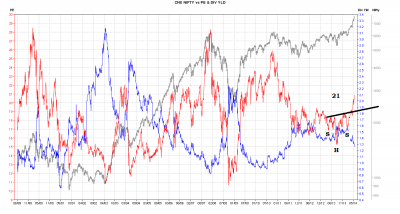
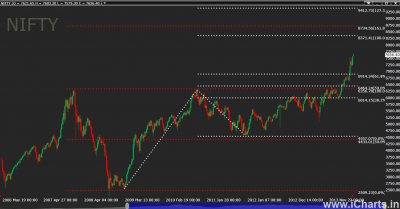
Current PE ratio is near 21 it kind a formed Head and Shoulders bottom projects it go near 23. So PE at 20.86 NIFTY @ 7656 so when PE reaches 23 market may near 8447. Usually Market tops are near PE ratio so as per that 9542 is estimated market top.
Therefore as per PE ratio NIFTY can go auto 8447 and 9452.
Now as per Fibonacci Projection is giving target of 8374 and
Fibonacci extension is giving a target of 8734 -- 9413
Note : Above Targets holds if NIFTY does not break below 6655.
| Description: |
|
| Filesize: |
168.91 KB |
| Viewed: |
624 Time(s) |
|
| Description: |
|
| Filesize: |
3.66 MB |
| Viewed: |
597 Time(s) |
|
|
|
| Back to top |
|
|
hemant.icharts
Site Admin
Joined: 10 May 2011
Posts: 334
|
| Post: #24 Posted: Wed Jun 11, 2014 2:29 pm Post subject: |
|
|
Positional High Risk Call :
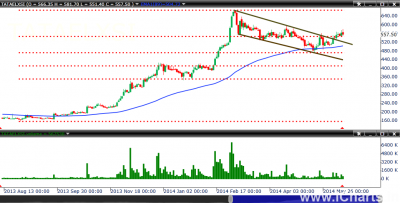
TATAELXSI has formed Flag/downward channel and gave breakout. Even were dry during the formation on FLAG which is good indication.
It took support @ 89 EMA and 38.2% retracements and bounces back from there.
Buy above DAILY close of 600 with Stop Loss of 503 and Target of 689 -- 801 -- 999.
| Description: |
|
| Filesize: |
2.09 MB |
| Viewed: |
611 Time(s) |
|
|
|
| Back to top |
|
|
hemant.icharts
Site Admin
Joined: 10 May 2011
Posts: 334
|
| Post: #25 Posted: Mon Jun 16, 2014 3:21 pm Post subject: |
|
|
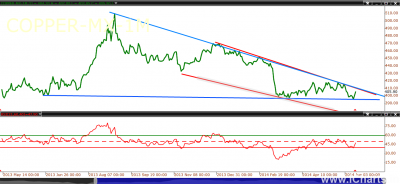
RSI giving divergence with Copper prices. Copper has formed downward channel which is yet to be broken on daily chart
Copper Buy above : 410 with Stop loss below 395 and Targets of 418 -- 434 -- 463.
| Description: |
|
| Filesize: |
3.04 MB |
| Viewed: |
576 Time(s) |
|
|
|
| Back to top |
|
|
hemant.icharts
Site Admin
Joined: 10 May 2011
Posts: 334
|
| Post: #26 Posted: Thu Jun 19, 2014 9:52 am Post subject: |
|
|
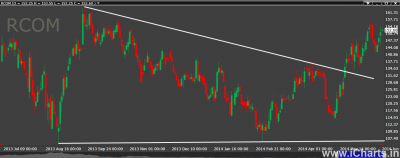
| hemant.icharts wrote: | Many Script have turned bullish for positional view.
They have come out of pattern on bullish side and their ADX is showing Strength and is above 25.
Prices are above moving averages of 610 days(long term moving average)
Please find the charts below with Targets and Stop Loss.
RCOM : Buy above Daily close of 144 with stop loss below 121 and Targets of (155 to 165) -- 189 -- 215 -- 262 -- 334.
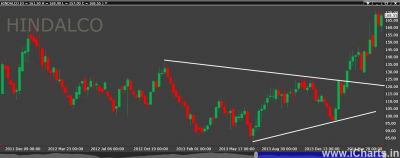
Hindalco: Buy above Weekly close of 155 with stop loss below 115 and Targets of 175 -- 204 -- 221 -- 262 -- 303.
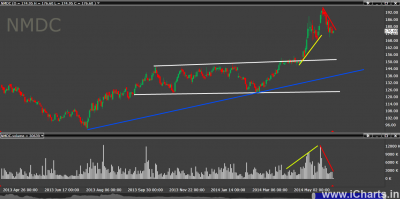
NMDC : Buy Above Daily Close of 166 with Stop loss below 150 and Targets of 193 -- 234 -- 262 -- 289 -- 315.
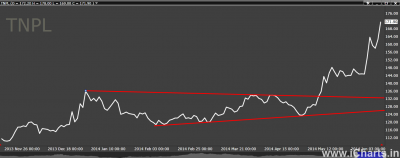
TNPL : Buy Above Daily Close of 142 with Stop loss below 131.50 and Targets of 155 -- 162 -- 189 -- 215. |
Update
Rcom : Yet go above target one that is above 165.
Hindalco : Target one achieved but not closing above it.
NMDC : Target one achieved but not closing above it. But in this fall from target 1 volumes have not been supporting. If one wants to enter now one can enter with stop loss of daily close below 162.
TNPL: Two targets achieved for TNPl, moving towards third target.
| Description: |
|
| Filesize: |
2.68 MB |
| Viewed: |
605 Time(s) |
|
| Description: |
|
| Filesize: |
2.68 MB |
| Viewed: |
592 Time(s) |
|
| Description: |
|
| Filesize: |
3.39 MB |
| Viewed: |
643 Time(s) |
|
| Description: |
|
| Filesize: |
2.68 MB |
| Viewed: |
555 Time(s) |
|
|
|
| Back to top |
|
|
hemant.icharts
Site Admin
Joined: 10 May 2011
Posts: 334
|
| Post: #27 Posted: Thu Jun 19, 2014 10:19 am Post subject: |
|
|
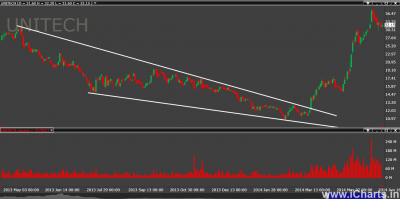
| hemant.icharts wrote: | Unitech on Daily chart crossed above 610 days moving average. Huge volumes in Unitech in past few trading sessions. As all the Infra scripts are moving ahead, keep an eye on this script.
Buy Above daily close of 24.60 or wait for retracement till 20 with stop-loss below below 18 and targets of 28 -- (32 to 34) -- 44 -- 49 -- 55 -- 62. |
Target one achieved but has closed above it. But in this fall from target 1 volumes have not been supporting. If one wants to enter now one can enter with stop loss of daily close below 30.
| Description: |
|
| Filesize: |
3.39 MB |
| Viewed: |
569 Time(s) |
|
|
|
| Back to top |
|
|
hemant.icharts
Site Admin
Joined: 10 May 2011
Posts: 334
|
| Post: #28 Posted: Mon Jun 23, 2014 12:16 pm Post subject: |
|
|
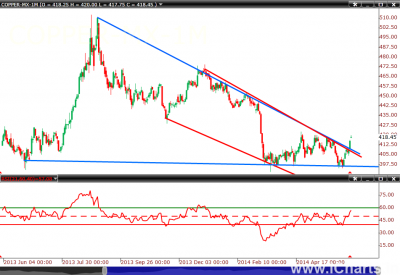
If one wants to enter now, wait for EOD close above 421 in current contract or 423 in August contract.
| hemant.icharts wrote: | RSI giving divergence with Copper prices. Copper has formed downward channel which is yet to be broken on daily chart
Copper Buy above : 410 with Stop loss below 395 and Targets of 418 -- 434 -- 463. |
| Description: |
|
| Filesize: |
2.38 MB |
| Viewed: |
551 Time(s) |
|
|
|
| Back to top |
|
|
hemant.icharts
Site Admin
Joined: 10 May 2011
Posts: 334
|
| Post: #29 Posted: Wed Jul 02, 2014 9:45 am Post subject: |
|
|
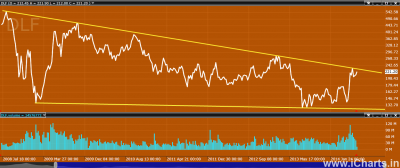
DLF
Forrming a triangle on weekly charts, close to giving a breakout with good volumes.
fractal nature:
30 min chart for DLF has given breakout of triangle with this sustains pushes the move upside then there might be a breakout in weekly chart.
Short Term view : Buy above 30 Min candle close of 221.55 with Stop loss below 218 and Targets of 226.30 -- 231 -- 243.
Long Term View : Buy above weekly close of 223 with Stop loss below 200 with Targets of 242 -- 270 -- 313.
| Description: |
|
| Filesize: |
2.96 MB |
| Viewed: |
594 Time(s) |
|
| Description: |
|
| Filesize: |
2.96 MB |
| Viewed: |
560 Time(s) |
|
|
|
| Back to top |
|
|
hemant.icharts
Site Admin
Joined: 10 May 2011
Posts: 334
|
| Post: #30 Posted: Thu Jul 03, 2014 12:47 pm Post subject: |
|
|
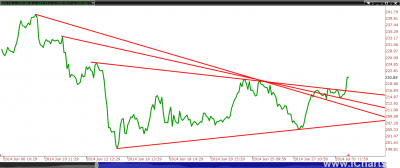
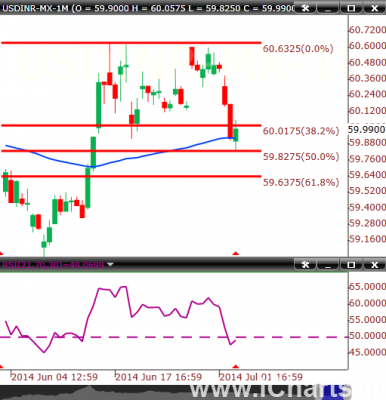
Swing / short term view:
Buy USDINR July Future when 4 hours candle close above 60.02 with Stop loss of 4 hour candle closing below 59.80 and Target of 60.20 -- 60.4000 -- 60.60 -- 61.00.
Sell USDINR July Future when 4 hours candle close below 59.80 with Stop loss of 4 hour candle closing above 60.25 and Target of 59.50 -- 59.21 -- 58.80
| Description: |
|
| Filesize: |
1.03 MB |
| Viewed: |
601 Time(s) |
|
|
|
| Back to top |
|
|
|


