| View previous topic :: View next topic |
| Author |
Positional / Swing Views. |
hemant.icharts
Site Admin
Joined: 10 May 2011
Posts: 334
|
Post: #31  Posted: Fri Jul 04, 2014 11:21 am Post subject: Posted: Fri Jul 04, 2014 11:21 am Post subject: |
 |
|
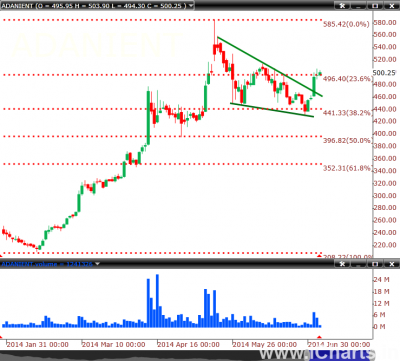
Adani Enterprise:
Daily chart has formed downward sloping wedge and gave break out above that..
Buy now with Stop loss below 434 with trailing targets of 534 -- 562 -- 655.
| Description: |
|
| Filesize: |
1.88 MB |
| Viewed: |
641 Time(s) |
|
|
|
| Back to top |
|
 |
|
|
|
hemant.icharts
Site Admin
Joined: 10 May 2011
Posts: 334
|
| Post: #32 Posted: Mon Jul 07, 2014 12:59 pm Post subject: |
|
|
| hemant.icharts wrote: | If one wants to enter now, wait for EOD close above 421 in current contract or 423 in August contract.
| hemant.icharts wrote: | RSI giving divergence with Copper prices. Copper has formed downward channel which is yet to be broken on daily chart
Copper Buy above : 410 with Stop loss below 395 and Targets of 418 -- 434 -- 463. |
|
Target two achieved
For re-entery buy when EOD closes above 435.55 With stop loss below @ 431.20 and trailing targets of 440 -- 463.
|
|
| Back to top |
|
|
hemant.icharts
Site Admin
Joined: 10 May 2011
Posts: 334
|
| Post: #33 Posted: Mon Jul 07, 2014 3:56 pm Post subject: |
|
|
| hemant.icharts wrote: | Swing / short term view:
Buy USDINR July Future when 4 hours candle close above 60.02 with Stop loss of 4 hour candle closing below 59.80 and Target of 60.20 -- 60.4000 -- 60.60 -- 61.00.
Sell USDINR July Future when 4 hours candle close below 59.80 with Stop loss of 4 hour candle closing above 60.25 and Target of 59.50 -- 59.21 -- 58.80 |
Target 1 Achieved, to start of journey upward, daily close above 60.27 will be helpful. 60.27 good resistance..
|
|
| Back to top |
|
|
hemant.icharts
Site Admin
Joined: 10 May 2011
Posts: 334
|
| Post: #34 Posted: Thu Jul 17, 2014 1:10 pm Post subject: |
|
|
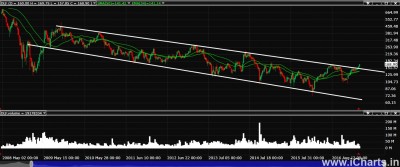
Rising Wedge in NIFTY
As all might be aware of rising wedge formation with break down of the wedge. Now NIFTY is coming back to bottom line of wedge. Chance of an entry on short side with stop which is very close.
Low Risk trade:
Sell NIFTY with hourly close below 7613 with stop loss above 7662 and Targets : 7568 -- 7530 -- 7460 -- 7355 -- 7189.
| Description: |
|
| Filesize: |
3.01 MB |
| Viewed: |
641 Time(s) |
|
|
|
| Back to top |
|
|
hemant.icharts
Site Admin
Joined: 10 May 2011
Posts: 334
|
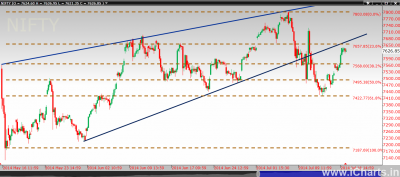
| Post: #35 Posted: Thu Dec 29, 2016 9:35 am Post subject: |
|
|
NIFTY Positional View
| Description: |
|
| Filesize: |
200.58 KB |
| Viewed: |
720 Time(s) |
|
|
|
| Back to top |
|
|
hemant.icharts
Site Admin
Joined: 10 May 2011
Posts: 334
|
|
| Back to top |
|
|
hemant.icharts
Site Admin
Joined: 10 May 2011
Posts: 334
|
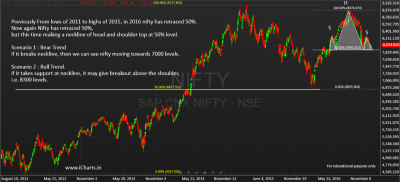
| Post: #37 Posted: Fri Jan 06, 2017 4:36 pm Post subject: |
|
|
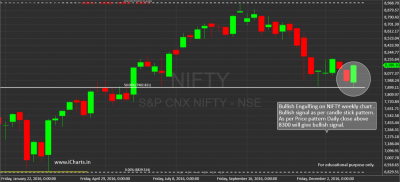
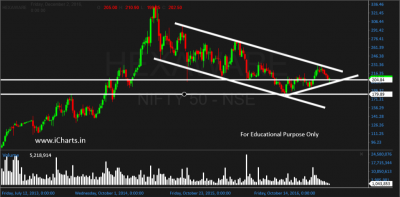
Nifty touched 8300 and felt resistance over there. Weekly closing above 8300 may give bullish signals.
| Description: |
|
| Filesize: |
155.5 KB |
| Viewed: |
549 Time(s) |
|
|
|
| Back to top |
|
|
hemant.icharts
Site Admin
Joined: 10 May 2011
Posts: 334
|
|
| Back to top |
|
|
hemant.icharts
Site Admin
Joined: 10 May 2011
Posts: 334
|
|
| Back to top |
|
|
hemant.icharts
Site Admin
Joined: 10 May 2011
Posts: 334
|
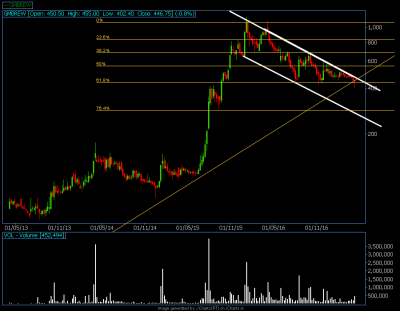
| Post: #40 Posted: Thu Apr 13, 2017 12:26 pm Post subject: |
|
|
G M Breweries Ltd is taking support @ 61.8 % retracement and about to give a breakout above weekly close above 515 with projection of 681 - 1080 with failure below weekly closing of 402.
Company has reduced their debt in last one year. Current debt is Rs. 0 Cr, and last year debt was Rs. 32.1 Cr. It is a debt free company
Consistently giving return on capital employed above 20%, with current return on employed at 58.98% .
Promoter Holdings is high @ 74.43%
Average Operating Margin of 5 years is at 4.56% compared to that current Operating margin is at 8.38% which shows over the period management has been working over increasing their Operating Margin.
For more infor on fundatamentals visit
http://fundata.in/companysearch/fullreport/G%20M%20Breweries%20Ltd%20%7C%20507488%20%7C%20GMBREW/G%20M%20Breweries
*** We DO NOT recommend anything here. The above is for educational purposes only. Please take your own decision about your investments.
| Description: |
|
| Filesize: |
21.57 KB |
| Viewed: |
491 Time(s) |
|
|
|
| Back to top |
|
|
hemant.icharts
Site Admin
Joined: 10 May 2011
Posts: 334
|
| Post: #41 Posted: Mon Apr 17, 2017 2:04 pm Post subject: DLF |
|
|
DLF gave breakout on weekly basis on multiple year trend line. Daily close above 180 can give 210 - 270 - 315 with failure below 138.
Interest coverage is low at 1.247.
Low return on Net Worth(Equity) at 1.87%
Price to Book value ratio shows company is reasonably priced.
For more information on fundamentals visit
http://fundata.in/companysearch/fullreport/DLF%20Ltd%20%7C%20532868%20%7C%20DLF/DLF
*** We DO NOT recommend anything here. The above is for educational purposes only. Please take your own decision about your investments.
| Description: |
|
| Filesize: |
204.29 KB |
| Viewed: |
501 Time(s) |
|
|
|
| Back to top |
|
|
hemant.icharts
Site Admin
Joined: 10 May 2011
Posts: 334
|
| Post: #42 Posted: Tue Apr 18, 2017 1:01 pm Post subject: |
|
|
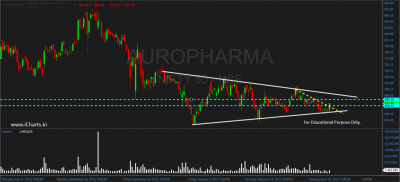
Auropharma looks like it may give a breakout soon near 680, pattern failure is very near @ 633 for a price movement to 684 -- 705 -- 750 -- 801 -- 900.
Average Operating Margin of 5 years is at 19.81% compared to that current Operating margin is at 23.99% which shows over the period management has been working over increasing their Operating Margin.
CAGR Sales 3 Years is at 33.39%
CAGR Sales 5 Years is at 25.97%
For more information on fundamentals visit:
http://fundata.in/companysearch/fullreport/Aurobindo%20Pharma%20Ltd%20%7C%20524804%20%7C%20AUROPHARMA/Aurobindo%20Pharma
| Description: |
|
| Filesize: |
96.86 KB |
| Viewed: |
472 Time(s) |
|
Last edited by hemant.icharts on Wed May 10, 2017 12:43 pm; edited 1 time in total |
|
| Back to top |
|
|
hemant.icharts
Site Admin
Joined: 10 May 2011
Posts: 334
|
| Post: #43 Posted: Thu Apr 20, 2017 9:20 am Post subject: |
|
|
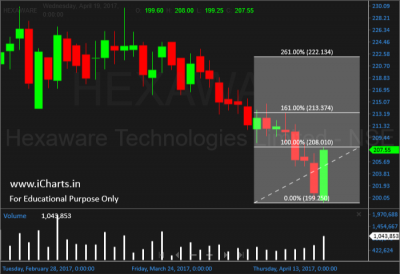
Positional and Swing View on HEXAWARE
Swing View : Bullish Engulfing on Daily charts confirmation above 208.80 Daily close. Shows a prices can reach 213 - 222
Positional View : Weekly chart also at support levels, Weekly close above 231 can give long term breakout.
It is nearly a debt free company i.e Total debt is Rs. 35.35 Cr, which is negligible compared to its Market Cap, which is Rs. 6,080.7 Cr.
Company is avaiable at 50% Price earning from it 5 year High of 30 & now currently @ 14.56 P/E
Company is provided substantial Dividend Yield at 4.31%.
Return on capital employed is 36.24%
Return on NetWorth(Equity) is 28.87%
Promoter Holdings is 71.20%
For more information on fundamentals visit:
http://fundata.in/companysearch/fullreport/Hexaware%20Technologies%20Ltd%20%7C%20532129%20%7C%20HEXAWARE/Hexaware%20Tech.
*** We DO NOT recommend anything here. The above is for educational purposes only. Please take your own decision about your investments.
| Description: |
|
| Filesize: |
60.53 KB |
| Viewed: |
475 Time(s) |
|
| Description: |
|
| Filesize: |
80.46 KB |
| Viewed: |
482 Time(s) |
|
|
|
| Back to top |
|
|
hemant.icharts
Site Admin
Joined: 10 May 2011
Posts: 334
|
| Post: #44 Posted: Wed Apr 26, 2017 9:43 am Post subject: |
|
|
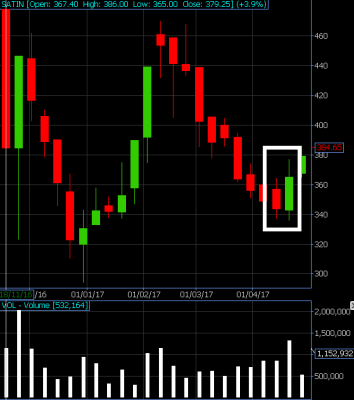
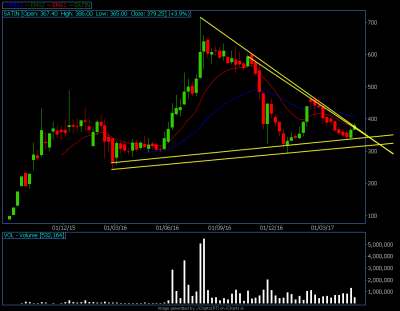
Positional and Swing View on Satin Creditcare Network Ltd
Swing View : Bullish Engulfing on weekly charts. Shows a prices can reach 405 - 450.
Positional View : Weekly chart also at support levels, Weekly close above 405 can give long term breakout for 582 - 750. With failure of pattern below 330.
Return On Net Worth is good @ 22%
Price to Book value @ 4.39
Price Earnings @ 17.08
Sales 5 Years CAGR % @ 57
Net Profit Growth CAGR(5 years) % @ 93
For more information on fundamentals visit:
http://fundata.in/companysearch/fullreport/Satin%20Creditcare%20Network%20Ltd%20%7C%20539404%20%7C%20SATIN/Satin%20Creditcare
*** We DO NOT recommend anything here. The above is for educational purposes only. Please take your own decision about your investments.
| Description: |
|
| Filesize: |
24.41 KB |
| Viewed: |
468 Time(s) |
|
| Description: |
|
| Filesize: |
23.99 KB |
| Viewed: |
465 Time(s) |
|
|
|
| Back to top |
|
|
hemant.icharts
Site Admin
Joined: 10 May 2011
Posts: 334
|
| Post: #45 Posted: Wed Apr 26, 2017 2:00 pm Post subject: |
|
|
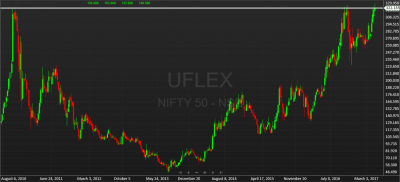
Positional View on UFLEX
Weekly chart may multi year breakout, Weekly close above 330 can give long term breakout for 390 - 474. With failure of pattern below 330.
Company has reduced their debt in couple of years by 16%
Current Profit Yield is at 15%
P/E Ratio at 7.05
PEG Ratio is at 0.77
Operating Margin is at 14%
For more information on fundamentals visit:
http://fundata.in/companysearch/fullreport/Uflex%20Ltd%20%7C%20500148%20%7C%20UFLEX/Uflex
*** We DO NOT recommend anything here. The above is for educational purposes only. Please take your own decision about your investments.
| Description: |
|
| Filesize: |
101.07 KB |
| Viewed: |
457 Time(s) |
|
|
|
| Back to top |
|
|
|