| View previous topic :: View next topic |
| Author |
Positional / Swing Views. |
hemant.icharts
Site Admin
Joined: 10 May 2011
Posts: 334
|
Post: #46  Posted: Wed May 03, 2017 10:01 pm Post subject: Posted: Wed May 03, 2017 10:01 pm Post subject: |
 |
|
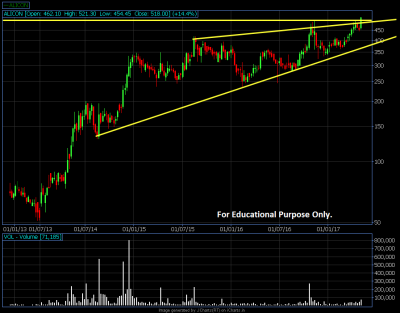
Positional View on ALICON
Weekly chart may multi year breakout, Weekly close above 501 can give long term breakout for 600 - 810. With failure of pattern below 420.
Current Price: ₹ 518
Stock P/E: 24.25
Earnings yield: 7.66%
YOY Quarterly sales growth: 5.33%
QoQ Sales: 18.44%
Sales growth 3Years: 12.6%
Sales growth 5Years: 19%
Debt/Equity : 1.34
Interest Coverage Ratio : 3.24
Return on Net worth(equity): 18.38%
Return on capital employed: 18.30%
Operating Margin: 11.12%
Promoter holding: 71.00%
For more information on fundamentals visit:
http://fundata.in/companysearch/ratio/console/Alicon%20Castalloy%20Ltd%20%7C%20531147%20%7C%20ALICON/Alicon%20Cast.
*** We DO NOT recommend anything here. The above is for educational purposes only. Please take your own decision about your investments.
| Description: |
|
| Filesize: |
38.55 KB |
| Viewed: |
591 Time(s) |
|
|
|
| Back to top |
|
 |
|
|
|
hemant.icharts
Site Admin
Joined: 10 May 2011
Posts: 334
|
| Post: #47 Posted: Tue May 09, 2017 1:22 pm Post subject: |
|
|
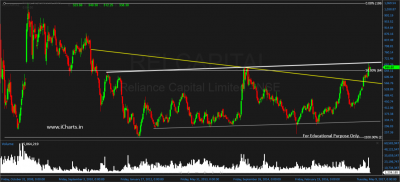
Positional View on RELCAPITAL
Weekly chart may multi year breakout, Weekly close above 690 can give long term breakout for 900 - 1200. With failure of pattern below 545.
Current Price: ₹ 670
Stock P/E: 13.39
Price to Book Value : 0.81
Dividend Yield : 1.51%
Earnings yield: 7.47%
YOY Quarterly sales growth: 79.30%
QoQ Sales: 27.58%
Sales growth 3Years: 10%
Sales growth 5Years: 13%
Return on Net worth(equity): 6%
Modified Operating Margin: 9%
Promoter holding: 52%
For more information on fundamentals visit:
http://fundata.in/companysearch/ratio/console/Reliance%20Capital%20Ltd%20%7C%20500111%20%7C%20RELCAPITAL/Reliance%20Capital
*** We DO NOT recommend anything here. The above is for educational purposes only. Please take your own decision about your investments.
| Description: |
|
| Filesize: |
122.89 KB |
| Viewed: |
507 Time(s) |
|
|
|
| Back to top |
|
|
hemant.icharts
Site Admin
Joined: 10 May 2011
Posts: 334
|
| Post: #48 Posted: Thu May 11, 2017 9:56 am Post subject: |
|
|
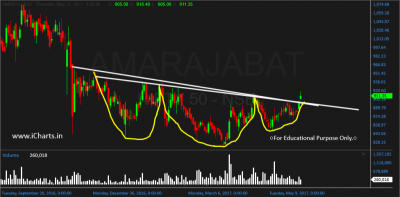
Amara Raja Batteries Ltd(Positional): Will breakout of Inverse Head and Shoulders above Daily close of 930 with Failure/stop loss below 850 can move up to 1131 - 1362 - 1743.
CMP : 915
P/E Ratio : 31.51
Price to Book Value : 7.31
Sales 3 Years CAGR : 16.6%
Sales 5 Years CAGR : 22%
Operating Margin : 16.50%
Debt/Equity : 0.04
Promoter Holding : 52.06%
Return On Net Worth(Equity) : 23.22 %
For more information on fundamentals visit:
http://fundata.in/companysearch/ratio/stand/Amara%20Raja%20Batteries%20Ltd%20%7C%20500008%20%7C%20AMARAJABAT/Amara%20Raja%20Batt.
*** We DO NOT recommend anything here. The above is for educational purposes only. Please take your own decision about your investments.
| Description: |
|
| Filesize: |
84.54 KB |
| Viewed: |
535 Time(s) |
|
|
|
| Back to top |
|
|
hemant.icharts
Site Admin
Joined: 10 May 2011
Posts: 334
|
| Post: #49 Posted: Wed May 17, 2017 1:01 pm Post subject: |
|
|
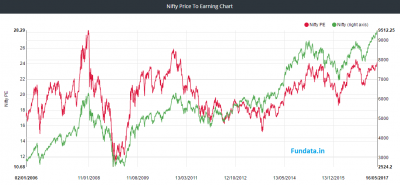
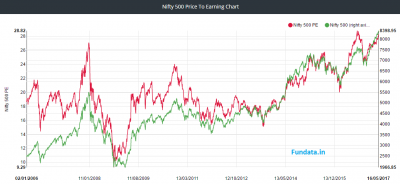
Are Earnings Improving ?
Nifty 50 & 500 has run up more than 6% & 10% from Sep'16, P/E is yet to break High of Sep'16.
http://fundata.in/marketbreadth/PEChart
| Description: |
|
| Filesize: |
63.35 KB |
| Viewed: |
527 Time(s) |
|
| Description: |
|
| Filesize: |
62.48 KB |
| Viewed: |
516 Time(s) |
|
|
|
| Back to top |
|
|
hemant.icharts
Site Admin
Joined: 10 May 2011
Posts: 334
|
| Post: #50 Posted: Wed May 17, 2017 1:58 pm Post subject: |
|
|
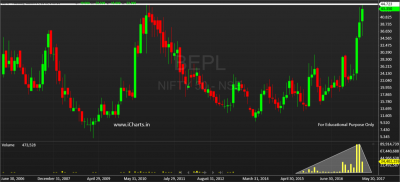
Bhansali Engineering Polymers Ltd Weekly chart may give multi year breakout, Weekly close above 45 can give long term breakout for 66 - 102. With failure of pattern below 33.
Promoter's holding has nearly increase by 10%.
Company has reduced their debt in last one year.
Market Cap.: ₹ 717.54Cr.
Stock P/E: 20368
Earnings yield(EBIT/EV): 10.36%
YOY Quarterly sales growth: 26.63%
Debt/Equity : 0.31
Return on Net worth(equity): 27.24%
Return on capital employed: 40.32%
Operating Margin: 10%
Promoter holding: 55%
For more information on fundamentals visit:
http://fundata.in/companysearch/ratio/stand/Bhansali%20Engineering%20Polymers%20Ltd%20%7C%20500052%20%7C%20BEPL/Bhansali%20Engg.
*** We DO NOT recommend anything here. The above is for educational purposes only. Please take your own decision about your investments.
| Description: |
|
| Filesize: |
94.18 KB |
| Viewed: |
571 Time(s) |
|
|
|
| Back to top |
|
|
hemant.icharts
Site Admin
Joined: 10 May 2011
Posts: 334
|
| Post: #51 Posted: Fri May 19, 2017 10:52 am Post subject: |
|
|
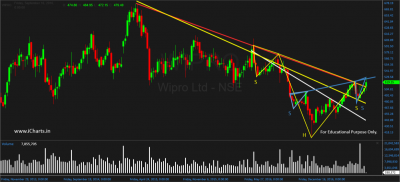
Positional View on Wipro Ltd
Weekly chart may give Inverse head and shoulders breakout, Weekly close above 540 can give long term breakout for 650- 774 - 1000. With failure of pattern below 480.
Current Price: ₹ 518
Stock P/E: 15.01
YOY Quarterly sales growth: 5.3%
QoQ Sales: 5.10%
Sales growth 3Years: 11%
Sales growth 5Years: 11%
Debt/Equity : 0.25
Return on Net worth(equity): 19%
Return on capital employed: 20%
Operating Margin: 21%
Promoter holding: 73.25%
For more information on fundamentals visit:
http://fundata.in/companysearch/ratio/console/Wipro%20Ltd%20%7C%20507685%20%7C%20WIPRO/Wipro
*** We DO NOT recommend anything here. The above is for educational purposes only. Please take your own decision about your investments.
| Description: |
|
| Filesize: |
136.83 KB |
| Viewed: |
556 Time(s) |
|
|
|
| Back to top |
|
|
hemant.icharts
Site Admin
Joined: 10 May 2011
Posts: 334
|
| Post: #52 Posted: Mon Sep 11, 2017 3:32 pm Post subject: |
|
|
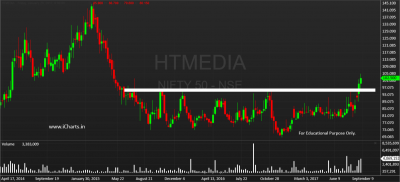
Positional View on H T Media Ltd
Weekly chart has given breakout, daily close above 108 can give long term breakout for 137-180-210-270. With failure of pattern below 81.
Current Price: ₹ 102.5
Market Cap (Rs Cr.) : 2381.02
Stock P/E: 9.18
Sales growth 3Years: 3.67%
Sales growth 5Years: 4%
Debt/Equity : 0.51
Price to Book Value : 1.07
Return on Net worth(equity): 12.28%
Return on capital employed: 11.62%
Promoter holding: 69.51%
For more information on fundamentals visit:
http://fundata.in/companysearch/report/H%20T%20Media%20Ltd%20%7C%20532662%20%7C%20HTMEDIA/H%20T%20Media
*** We DO NOT recommend anything here. The above is for educational purposes only. Please take your own decision about your investments.
| Description: |
|
| Filesize: |
96.59 KB |
| Viewed: |
516 Time(s) |
|
|
|
| Back to top |
|
|
hemant.icharts
Site Admin
Joined: 10 May 2011
Posts: 334
|
| Post: #53 Posted: Tue Sep 12, 2017 2:23 pm Post subject: |
|
|
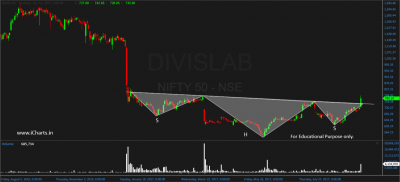
Positional View on Divis Lab Ltd
Daily chart may give Inverse head and shoulders breakout, Daily close above 810 can give long term breakout for 855-963- 1233. With failure of pattern below 666.
Current Price: ₹ 782
Stock P/E: 21
YOY Quarterly sales growth: -19.27%
Sales growth 3Years: 17%
Sales growth 5Years: 17%
Debt/Equity : 0.01
Return on Net worth(equity): 17%
Return on capital employed: 21%
Operating Margin: 30%
Promoter holding: 52.07%
For more information on fundamentals visit:
http://fundata.in/companysearch/analysis/Divis%20Laboratories%20Ltd%20%7C%20532488%20%7C%20DIVISLAB/Divi's%20Lab.
*** We DO NOT recommend anything here. The above is for educational purposes only. Please take your own decision about your investments.
| Description: |
|
| Filesize: |
96.29 KB |
| Viewed: |
540 Time(s) |
|
|
|
| Back to top |
|
|
hemant.icharts
Site Admin
Joined: 10 May 2011
Posts: 334
|
| Post: #54 Posted: Thu Sep 14, 2017 2:15 pm Post subject: |
|
|
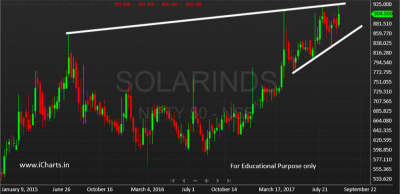
Positional View on Solar Industries India Ltd Ltd
Chart may give breakout, Daily close above 927 can give long term breakout for 1026-1167- 1305. With failure of pattern below 846.
Current Price: ₹ 782
Stock P/E: 40.02
YOY Quarterly sales growth: 15.79%
Sales growth 3Years: 11.72%
Sales growth 5Years: 10%
Debt/Equity : 0.52
Return on Net worth(equity): 22.02%
Return on capital employed: 20.7%
Operating Margin: 19.51%
Promoter holding: 52.07%
For more information on fundamentals visit:
http://fundata.in/companysearch/analysis/Solar%20Industries%20India%20Ltd%20%7C%20532725%20%7C%20SOLARINDS/Solar%20Inds.
*** WE DO NOT recommend anything here. The above is for educational purposes only. Please take your own decision about your investments.
| Description: |
|
| Filesize: |
85.39 KB |
| Viewed: |
529 Time(s) |
|
|
|
| Back to top |
|
|
hemant.icharts
Site Admin
Joined: 10 May 2011
Posts: 334
|
| Post: #55 Posted: Wed Oct 04, 2017 4:55 pm Post subject: |
|
|
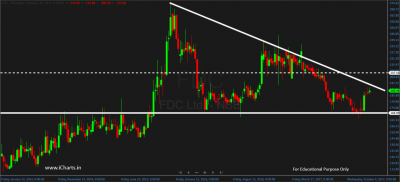
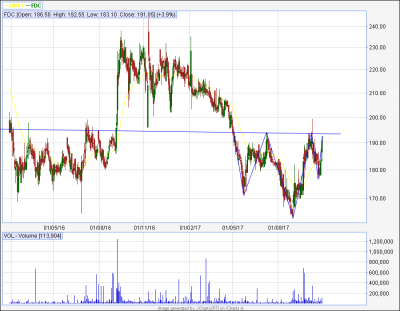
Positional View on FDC Ltd
Chart may give breakout, Weekly close above 208.80 can give long term breakout for 243-297-333-369-441 . With failure of pattern below 162
It is nearly debt free company.
Current Price: ₹ 190
Stock P/E: 20
YOY Quarterly sales growth: -10%
Sales growth 3Years: 7%
Sales growth 5Years: 7%
Return on Net worth(equity): 16.03%
Return on capital employed: 21.50%
Operating Margin: 27.39%
Promoter holding: 68.89%
For more information on fundamentals visit:
http://fundata.in/companysearch/analysis/FDC
*** WE DO NOT recommend anything here. The above is for educational purposes only. Please take your own decision about your investments.
| Description: |
|
| Filesize: |
89 KB |
| Viewed: |
576 Time(s) |
|
Last edited by hemant.icharts on Thu Nov 02, 2017 10:17 am; edited 1 time in total |
|
| Back to top |
|
|
hemant.icharts
Site Admin
Joined: 10 May 2011
Posts: 334
|
| Post: #56 Posted: Thu Oct 12, 2017 5:21 pm Post subject: |
|
|
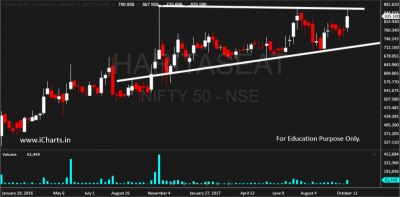
Positional View on Harita Seating Systems Ltd
Chart may give breakout, Weekly close above 873 can give long term breakout for 1008-1200-1500-1800-2400. With failure of pattern below 693
It is nearly debt free company.
Current Price: ₹ 830
Stock P/E: 23.05
YOY Quarterly sales growth: 12.74%
Sales growth 3Years: 11.45%
Sales growth 5Years: 5%
Return on Net worth(equity): 34.53%
Return on capital employed: 43.93%
Debt to Equity : 0.08
Operating Margin: 8.5%
Promoter holding: 66.35%
For more information on fundamentals visit:
http://fundata.in/companysearch/report/Harita%20Seating%20Systems%20Ltd%20%7C%20590043%20%7C%20HARITASEAT/Harita%20Seating
*** WE DO NOT recommend anything here. The above is for educational purposes only. Please take your own decision about your investments.
| Description: |
|
| Filesize: |
68.76 KB |
| Viewed: |
489 Time(s) |
|
|
|
| Back to top |
|
|
hemant.icharts
Site Admin
Joined: 10 May 2011
Posts: 334
|
| Post: #57 Posted: Mon Oct 16, 2017 12:46 pm Post subject: |
|
|
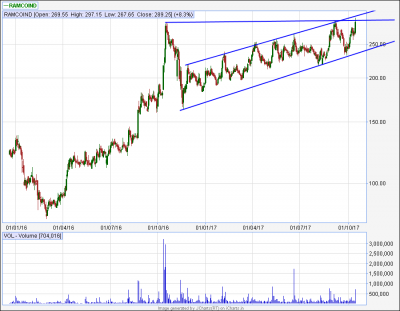
Positional View on Ramco Industries Ltd
Chart may give breakout, Daily close above 297 can give long term breakout for 378 - 500 - 600. With failure of pattern below 230
Current Price: ₹ 290
Stock P/E: 37.48
YOY Quarterly sales growth: 9.77%
Sales growth 3Years: 2.62%
Sales growth 5Years: 2%
Return on Net worth(equity): 1.85%
Return on capital employed: 3.43%
Debt to Equity : 0.13
Operating Margin: 13.45%
Promoter holding: 53.92%
For more information on fundamentals visit:
http://fundata.in/companysearch/report/Ramco%20Industries%20Ltd%20%7C%20532369%20%7C%20RAMCOIND/Ramco%20Inds.
*** WE DO NOT recommend anything here. The above is for educational purposes only. Please take your own decision about your investments.
| Description: |
|
| Filesize: |
23.19 KB |
| Viewed: |
508 Time(s) |
|
|
|
| Back to top |
|
|
hemant.icharts
Site Admin
Joined: 10 May 2011
Posts: 334
|
| Post: #58 Posted: Tue Oct 17, 2017 9:56 am Post subject: |
|
|
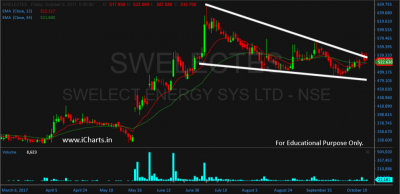
Positional View on Swelect Energy Systems Ltd
Chart may give breakout, Daily close above 560 can give long term breakout for 658 - 702- 927. With failure of pattern below 486
Current Price: 530
Stock P/E: 16
YOY Quarterly sales growth: 21.87%
Sales growth 3Years: 11%
Return on Net worth(equity): 1%
Return on capital employed: 2.32%
Debt to Equity : 0.18
Operating Margin: 15.5%
Promoter holding: 63.46%
For more information on fundamentals visit:
http://fundata.in/companysearch/report/Swelect%20Energy%20Systems%20Ltd%20%7C%20532051%20%7C%20SWELECTES/Swelect%20Energy
*** WE DO NOT recommend anything here. The above is for educational purposes only. Please take your own decision about your investments.
| Description: |
|
| Filesize: |
86.97 KB |
| Viewed: |
505 Time(s) |
|
|
|
| Back to top |
|
|
hemant.icharts
Site Admin
Joined: 10 May 2011
Posts: 334
|
| Post: #59 Posted: Tue Oct 31, 2017 3:13 pm Post subject: |
|
|
Update:
Looks like Inverse Head and Shoulder breakout can happen above 200
| hemant.icharts wrote: | Positional View on FDC Ltd
Chart may give breakout, Weekly close above 208.80 can give long term breakout for 243-297-333-369-441 . With failure of pattern below 162
It is nearly debt free company.
Current Price: ₹ 190
Stock P/E: 20
YOY Quarterly sales growth: -10%
Sales growth 3Years: 7%
Sales growth 5Years: 7%
Return on Net worth(equity): 16.03%
Return on capital employed: 21.50%
Operating Margin: 27.39%
Promoter holding: 68.89%
For more information on fundamentals visit:
http://fundata.in/companysearch/analysis/FDC
*** WE DO NOT recommend anything here. The above is for educational purposes only. Please take your own decision about your investments. |
| Description: |
|
| Filesize: |
30.82 KB |
| Viewed: |
519 Time(s) |
|
|
|
| Back to top |
|
|
hemant.icharts
Site Admin
Joined: 10 May 2011
Posts: 334
|
| Post: #60 Posted: Thu Nov 23, 2017 5:37 pm Post subject: |
|
|
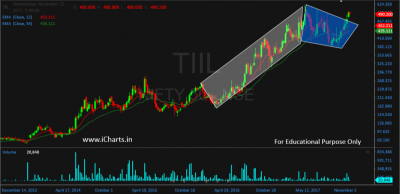
Positional View on Technocraft Industries (India) Ltd
Chart may give breakout, Daily close above 511 can give long term breakout for 585- 700- 810-1050. With failure of pattern below 378
Current Price: 530
Stock P/E: 13.63
YOY Quarterly sales growth: 21.87%
Sales growth 5 Years: 9%
Sales growth (YoY): 13.82%
Net Profit Growth (YoY): 27.50%
Return on Net worth(equity): 14.82%
Return on capital employed: 15.63%
Debt to Equity : 0.46
Operating Margin: 13.32%
Promoter holding: 75%
For more information on fundamentals visit:
http://fundata.in/companysearch/report/TIIL
*** WE DO NOT recommend anything here. The above is for educational purposes only. Please take your own decision about your investments.
| Description: |
|
| Filesize: |
90.69 KB |
| Viewed: |
453 Time(s) |
|
|
|
| Back to top |
|
|
|


