| View previous topic :: View next topic |
| Author |
Positional / Swing Views. |
hemant.icharts
Site Admin
Joined: 10 May 2011
Posts: 334
|
Post: #1  Posted: Fri Dec 20, 2013 2:03 pm Post subject: Positional / Swing Views. Posted: Fri Dec 20, 2013 2:03 pm Post subject: Positional / Swing Views. |
 |
|
| In this Section I will be posting positional / swing views.
|
|
| Back to top |
|
 |
|
|
|
hemant.icharts
Site Admin
Joined: 10 May 2011
Posts: 334
|
| Post: #2 Posted: Thu Mar 06, 2014 10:33 am Post subject: |
|
|
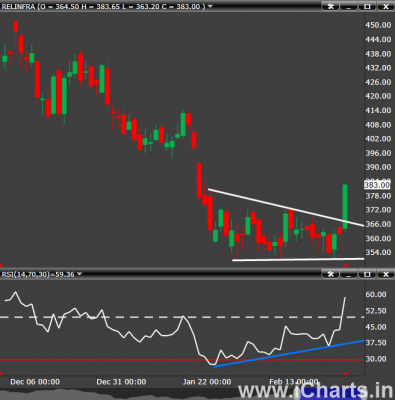
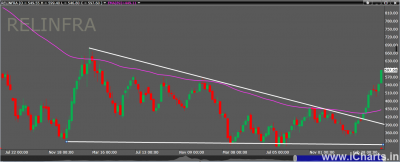
Rel Infra has given upside breakout of descending triangle on daily chart with positive divergence on RSI.
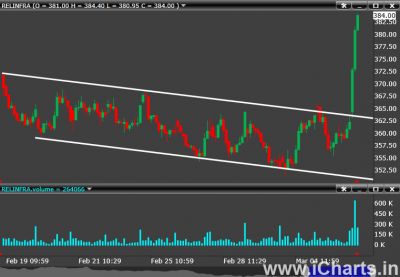
There has been break of a downward channel on a 30 min chart with good volumes..
To confirm the trend please wait for a daily candles to close above 385..
Buy above 385 with Stop loss of 372 and target of 408 -- 423 -- 441.
| Description: |
|
| Filesize: |
1.66 MB |
| Viewed: |
736 Time(s) |
|
| Description: |
|
| Filesize: |
1.53 MB |
| Viewed: |
729 Time(s) |
|
|
|
| Back to top |
|
|
hemant.icharts
Site Admin
Joined: 10 May 2011
Posts: 334
|
| Post: #3 Posted: Tue Mar 11, 2014 10:11 am Post subject: |
|
|
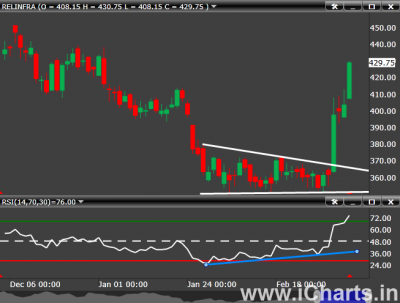
Reached Target 2 of 423..
| hemant.icharts wrote: | Rel Infra has given upside breakout of descending triangle on daily chart with positive divergence on RSI.
There has been break of a downward channel on a 30 min chart with good volumes..
To confirm the trend please wait for a daily candles to close above 385..
Buy above 385 with Stop loss of 372 and target of 408 -- 423 -- 441. |
| Description: |
|
| Filesize: |
1.23 MB |
| Viewed: |
651 Time(s) |
|
|
|
| Back to top |
|
|
hemant.icharts
Site Admin
Joined: 10 May 2011
Posts: 334
|
| Post: #4 Posted: Tue Mar 11, 2014 2:18 pm Post subject: |
|
|
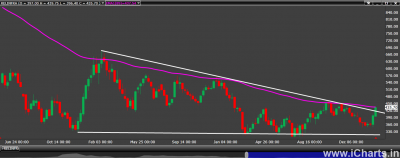
Almost Reached the last target missed by a point.
If this week price closes above above 435 it will give breakout of triangle on Weekly chart.
Previous three tops found resistances near EMA of 89 weeks. It may retrace from here now.
To continue upward journey on positional bases buy above weekly close of 450 with stop loss of 434 and targets of 533 -- 576 -- 644 -- 721 -- 821.
| hemant.icharts wrote: | Reached Target 2 of 423..
| hemant.icharts wrote: | Rel Infra has given upside breakout of descending triangle on daily chart with positive divergence on RSI.
There has been break of a downward channel on a 30 min chart with good volumes..
To confirm the trend please wait for a daily candles to close above 385..
Buy above 385 with Stop loss of 372 and target of 408 -- 423 -- 441. |
|
| Description: |
|
| Filesize: |
2.78 MB |
| Viewed: |
644 Time(s) |
|
Last edited by hemant.icharts on Wed May 14, 2014 9:51 am; edited 1 time in total |
|
| Back to top |
|
|
hemant.icharts
Site Admin
Joined: 10 May 2011
Posts: 334
|
| Post: #5 Posted: Wed Mar 12, 2014 4:54 pm Post subject: |
|
|
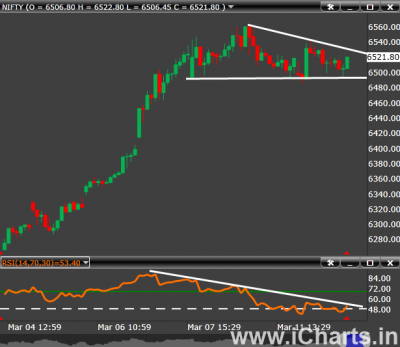
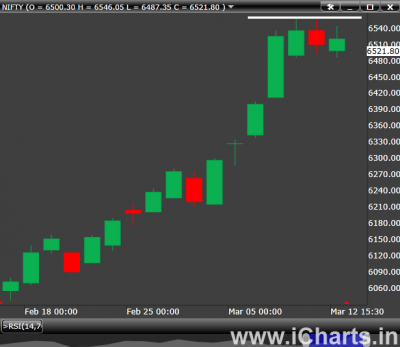
Nifty forming a triangle on 30 min chart with negative divergence on RSI. Tweezers top on daily chart for NIFTY..
Down side below two 30 mins candle close of 6462 with stop loss of 6508 with support levels of 6434 -- 6362 -- 6236
| Description: |
|
| Filesize: |
1.25 MB |
| Viewed: |
662 Time(s) |
|
| Description: |
|
| Filesize: |
1.25 MB |
| Viewed: |
743 Time(s) |
|
|
|
| Back to top |
|
|
hemant.icharts
Site Admin
Joined: 10 May 2011
Posts: 334
|
| Post: #6 Posted: Thu Mar 13, 2014 8:54 am Post subject: To support the view for of NIFTY finding resistance |
|
|
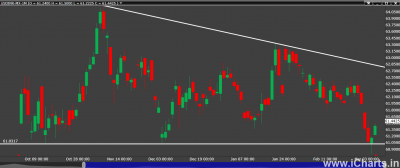
USDINR Has taken support on trend line which previous two lows. It has formed an hammer and forming a descending triangle on a daily chart. Up move can be expected in USD-INR.
Since NIFTY is said to be inversely correlated with USD-INR, NIFTY may start to move in a downward direction.
| Description: |
|
| Filesize: |
2.95 MB |
| Viewed: |
724 Time(s) |
|
|
|
| Back to top |
|
|
hemant.icharts
Site Admin
Joined: 10 May 2011
Posts: 334
|
| Post: #7 Posted: Fri Mar 14, 2014 9:16 am Post subject: |
|
|
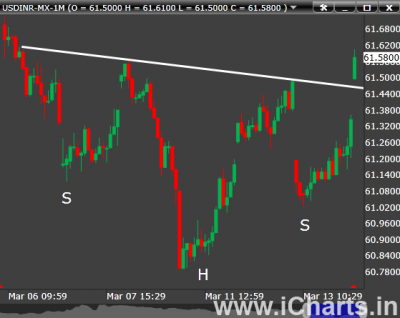
USD-INR formed Head and Shoulder bottom on 30 min chart.today is opened above the neck line with gap.
It had formed a hammer on a daily chart 3 days ago, yesterday it was threatening to go below the low of hammer, but eventually it closed on positive not yesterday..
USD-INR bullish above 61.6100 with stop loss of 61.21 and targets of 62.05 -- 62.34 -- 62.8000
| Description: |
|
| Filesize: |
972.29 KB |
| Viewed: |
590 Time(s) |
|
|
|
| Back to top |
|
|
hemant.icharts
Site Admin
Joined: 10 May 2011
Posts: 334
|
| Post: #8 Posted: Fri Mar 14, 2014 10:31 am Post subject: |
|
|
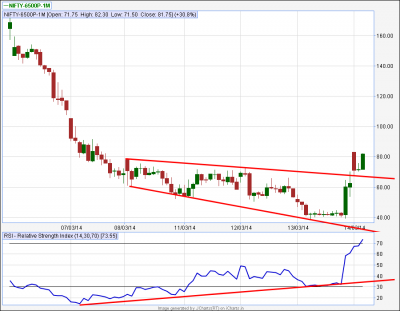
NIFTY-6500P-1M gave breakout of broadening triangle and positive divergence on RSI on 30 min chart.
Buy when 30 min candle closes above 83 with Stop loss of 62 and target of 98 -- 121 -- 144
| Description: |
|
| Filesize: |
23.93 KB |
| Viewed: |
618 Time(s) |
|
|
|
| Back to top |
|
|
hemant.icharts
Site Admin
Joined: 10 May 2011
Posts: 334
|
| Post: #9 Posted: Tue Apr 01, 2014 9:28 am Post subject: |
|
|
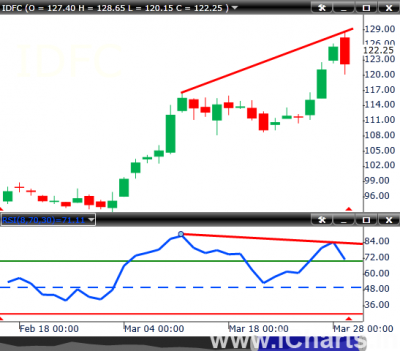
Bearish Engulfing has formed in IDFC on a Daily.
There is negative divergence on RSI with price.
Sell IDFC with candle close below 120 with stop loss above 126 and target of 115 and 106.30
| Description: |
|
| Filesize: |
1 MB |
| Viewed: |
692 Time(s) |
|
|
|
| Back to top |
|
|
hemant.icharts
Site Admin
Joined: 10 May 2011
Posts: 334
|
| Post: #10 Posted: Thu May 08, 2014 9:37 am Post subject: |
|
|
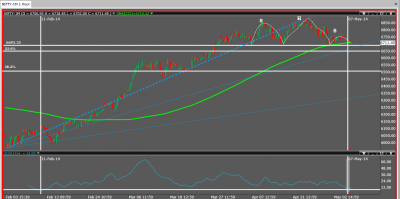
Continuous Future Chart of NIFTY Future :
-> There looks like pattern which is similar to Head and Shoulder Top. Not a perfect one but acceptable.
-> ADX is close to it bottom ranges suggesting possible start of a trending move.
->Prices are close to SMA of 233 period, taking support.
-> Once price fall First line of speed lines which one-third line, one expect some bearishness.
-> Prices are near 23.6% retracement levels. Once broken next support to be expected at 38.2%
Down Side move can be expect after hourly close below 6650 and with movement up to 6650 -- 6334 -- 6289 -- 6162 -- 6055. Close above 6789 will fail the pattern and this down move may be considered as a retracement of 23.6%.
| Description: |
|
| Filesize: |
130.14 KB |
| Viewed: |
678 Time(s) |
|
|
|
| Back to top |
|
|
hemant.icharts
Site Admin
Joined: 10 May 2011
Posts: 334
|
| Post: #11 Posted: Wed May 14, 2014 9:53 am Post subject: |
|
|
621 to 644 may be resistance zone for Reliance Infra. This was the call which got triggered and took off..
All other calls which i gave never got triggered..
| hemant.icharts wrote: | Almost Reached the last target missed by a point.
If this week price closes above above 435 it will give breakout of triangle on Weekly chart.
Previous three tops found resistances near EMA of 89 weeks. It may retrace from here now.
To continue upward journey on positional bases buy above weekly close of 450 with stop loss of 434 and targets of 533 -- 576 -- 644 -- 721 -- 821.
| hemant.icharts wrote: | Reached Target 2 of 423..
| hemant.icharts wrote: | Rel Infra has given upside breakout of descending triangle on daily chart with positive divergence on RSI.
There has been break of a downward channel on a 30 min chart with good volumes..
To confirm the trend please wait for a daily candles to close above 385..
Buy above 385 with Stop loss of 372 and target of 408 -- 423 -- 441. |
|
|
| Description: |
|
| Filesize: |
55.06 KB |
| Viewed: |
611 Time(s) |
|
|
|
| Back to top |
|
|
hemant.icharts
Site Admin
Joined: 10 May 2011
Posts: 334
|
| Post: #12 Posted: Mon May 19, 2014 3:18 pm Post subject: |
|
|
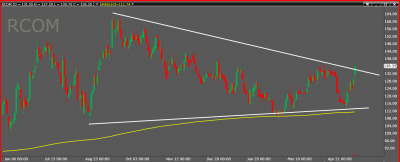
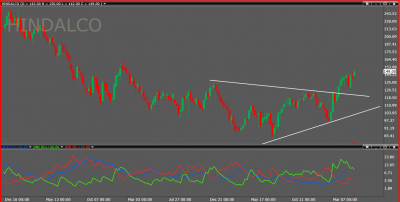
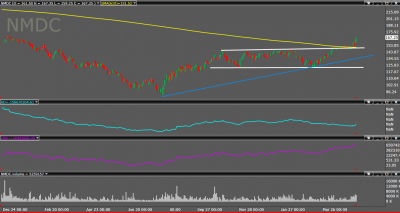
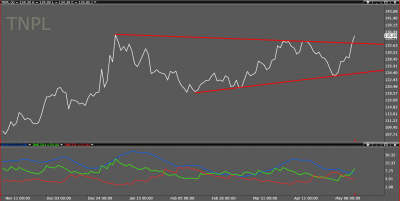
Many Script have turned bullish for positional view.
They have come out of pattern on bullish side and their ADX is showing Strength and is above 25.
Prices are above moving averages of 610 days(long term moving average)
Please find the charts below with Targets and Stop Loss.
RCOM : Buy above Daily close of 144 with stop loss below 121 and Targets of (155 to 165) -- 189 -- 215 -- 262 -- 334.
Hindalco: Buy above Weekly close of 155 with stop loss below 115 and Targets of 175 -- 204 -- 221 -- 262 -- 303.
NMDC : Buy Above Daily Close of 166 with Stop loss below 150 and Targets of 193 -- 234 -- 262 -- 289 -- 315.
TNPL : Buy Above Daily Close of 142 with Stop loss below 131.50 and Targets of 155 -- 162 -- 189 -- 215.
| Description: |
|
| Filesize: |
91 KB |
| Viewed: |
640 Time(s) |
|
| Description: |
|
| Filesize: |
127.49 KB |
| Viewed: |
617 Time(s) |
|
| Description: |
|
| Filesize: |
123.1 KB |
| Viewed: |
643 Time(s) |
|
| Description: |
|
| Filesize: |
107.73 KB |
| Viewed: |
615 Time(s) |
|
Last edited by hemant.icharts on Mon May 26, 2014 11:22 am; edited 1 time in total |
|
| Back to top |
|
|
hemant.icharts
Site Admin
Joined: 10 May 2011
Posts: 334
|
| Post: #13 Posted: Mon May 19, 2014 3:22 pm Post subject: |
|
|
4th targets also achieved, did not expect this to reach so fast. 
| hemant.icharts wrote: | 621 to 644 may be resistance zone for Reliance Infra. This was the call which got triggered and took off..
All other calls which i gave never got triggered..
| hemant.icharts wrote: | Almost Reached the last target missed by a point.
If this week price closes above above 435 it will give breakout of triangle on Weekly chart.
Previous three tops found resistances near EMA of 89 weeks. It may retrace from here now.
To continue upward journey on positional bases buy above weekly close of 450 with stop loss of 434 and targets of 533 -- 576 -- 644 -- 721 -- 821.
| hemant.icharts wrote: | Reached Target 2 of 423..
| hemant.icharts wrote: | Rel Infra has given upside breakout of descending triangle on daily chart with positive divergence on RSI.
There has been break of a downward channel on a 30 min chart with good volumes..
To confirm the trend please wait for a daily candles to close above 385..
Buy above 385 with Stop loss of 372 and target of 408 -- 423 -- 441. |
|
|
|
|
|
| Back to top |
|
|
hemant.icharts
Site Admin
Joined: 10 May 2011
Posts: 334
|
| Post: #14 Posted: Mon May 19, 2014 4:19 pm Post subject: |
|
|
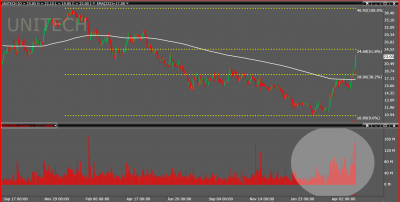
Unitech on Daily chart crossed above 610 days moving average. Huge volumes in Unitech in past few trading sessions. As all the Infra scripts are moving ahead, keep an eye on this script.
Buy Above daily close of 24.60 or wait for retracement till 20 with stop-loss below below 18 and targets of 28 -- (32 to 34) -- 44 -- 49 -- 55 -- 62.
| Description: |
|
| Filesize: |
117.96 KB |
| Viewed: |
587 Time(s) |
|
|
|
| Back to top |
|
|
hemant.icharts
Site Admin
Joined: 10 May 2011
Posts: 334
|
| Post: #15 Posted: Tue May 20, 2014 12:56 pm Post subject: |
|
|
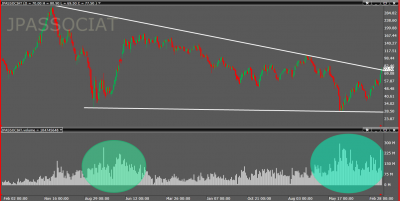
With infrastructure sector booming. It is not only rising it is rising with volume.
JPASSOCIAT forming descending triangle on a weekly chart.
Note : There is strong volume in the last movement. Which was present in the last bullish move it has in 2009.
Speculation is rising so there must cautious buying with stop loss to be used in every trade.
Buy above Weekly close of 82 with stop loss of below 67 and targets of 101 -- 121 -- 162 -- 189 -- 255.
| Description: |
|
| Filesize: |
127.77 KB |
| Viewed: |
612 Time(s) |
|
|
|
| Back to top |
|
|
|


