| View previous topic :: View next topic |
| Author |
quick chart view |
chrome
Yellow Belt

Joined: 28 Dec 2009
Posts: 645
|
Post: #1  Posted: Thu Dec 09, 2010 1:08 pm Post subject: quick chart view Posted: Thu Dec 09, 2010 1:08 pm Post subject: quick chart view |
 |
|
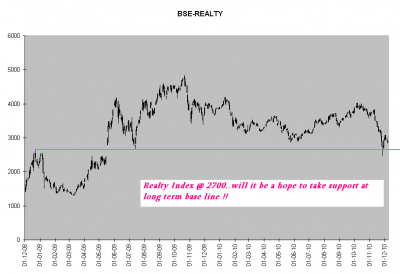
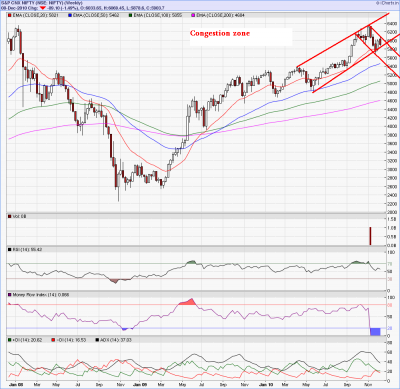
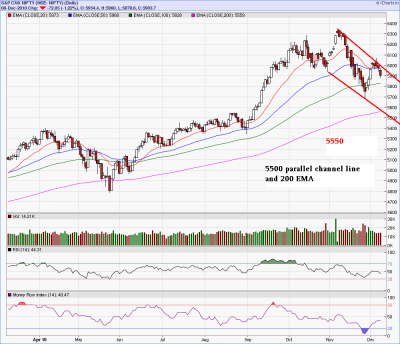
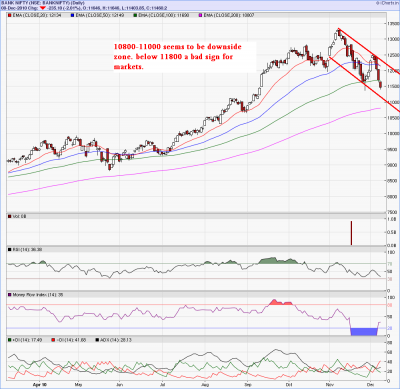
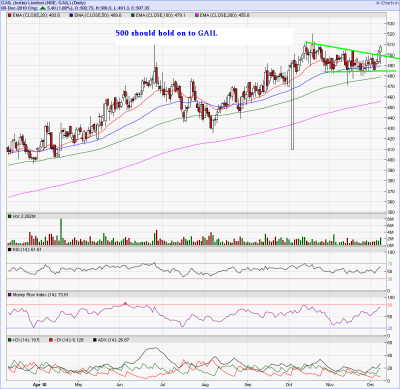
some quick charts with current market view.
| Description: |
|
| Filesize: |
106.72 KB |
| Viewed: |
875 Time(s) |
|
| Description: |
|
| Filesize: |
81.25 KB |
| Viewed: |
783 Time(s) |
|
| Description: |
|
| Filesize: |
97.04 KB |
| Viewed: |
801 Time(s) |
|
| Description: |
|
| Filesize: |
91.71 KB |
| Viewed: |
751 Time(s) |
|
| Description: |
|
| Filesize: |
102.83 KB |
| Viewed: |
739 Time(s) |
|
| Description: |
|
| Filesize: |
100.62 KB |
| Viewed: |
734 Time(s) |
|
|
|
| Back to top |
|
 |
|
|
|
chrome
Yellow Belt
Joined: 28 Dec 2009
Posts: 645
|
|
| Back to top |
|
|
chrome
Yellow Belt
Joined: 28 Dec 2009
Posts: 645
|
| Post: #3 Posted: Thu Dec 09, 2010 1:45 pm Post subject: Power Index |
|
|
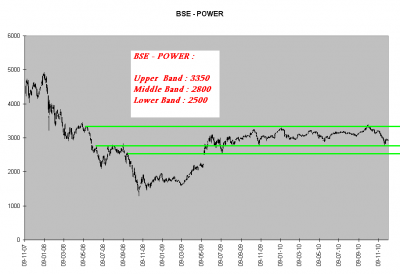
Power Index quick view....we are at middle channel right now..
| Description: |
|
| Filesize: |
21.34 KB |
| Viewed: |
714 Time(s) |
|
|
|
| Back to top |
|
|
chrome
Yellow Belt
Joined: 28 Dec 2009
Posts: 645
|
| Post: #4 Posted: Thu Dec 09, 2010 1:53 pm Post subject: BSE-CG |
|
|
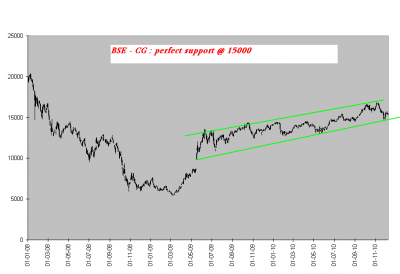
BSE - CG : perfect support @ 15000
| Description: |
|
| Filesize: |
20.49 KB |
| Viewed: |
785 Time(s) |
|
|
|
| Back to top |
|
|
nksachdev
White Belt

Joined: 17 Mar 2009
Posts: 11
|
| Post: #5 Posted: Thu Dec 09, 2010 9:19 pm Post subject: nifty |
|
|
I refer yr chart of nifty spot.
We can use andrews pitch fork which is picking up exact high and lows on weekly charts.
|
|
| Back to top |
|
|
chrome
Yellow Belt
Joined: 28 Dec 2009
Posts: 645
|
| Post: #6 Posted: Thu Dec 09, 2010 9:36 pm Post subject: Re: nifty |
|
|
| nksachdev wrote: | I refer yr chart of nifty spot.
We can use andrews pitch fork which is picking up exact high and lows on weekly charts. |
hi nksachdev, can u plz post the chart...
|
|
| Back to top |
|
|
chrome
Yellow Belt
Joined: 28 Dec 2009
Posts: 645
|
| Post: #7 Posted: Sat Jan 01, 2011 12:07 pm Post subject: SBI |
|
|
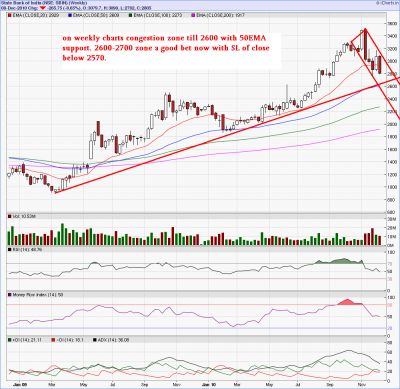
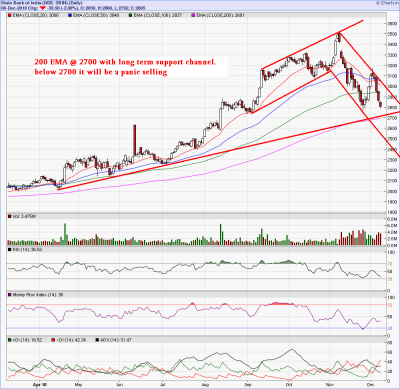
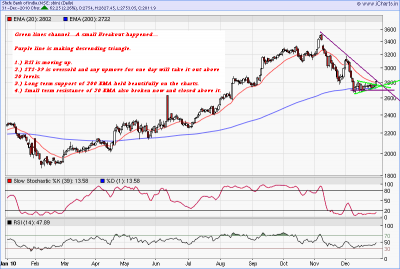
Green lines channel...A small Breakout happened...
Purple line is making descending triangle but ignoring it for a while.
1.) RSI is moving up.
2.) STS-39 is oversold and any upmove for one day will take it out above 20 levels.
3.) Long term support of 200 EMA held beautifully on the charts.
4.) Small term resistance of 20 EMA also broken now and closed above it.
All sumed up, I am positive on SBI for atleast 400 points with SL of closing below 2690.
| Description: |
|
| Filesize: |
47.42 KB |
| Viewed: |
865 Time(s) |
|
|
|
| Back to top |
|
|
chetan83
Brown Belt

Joined: 19 Feb 2010
Posts: 2037
|
| Post: #8 Posted: Sat Jan 01, 2011 12:58 pm Post subject: Happy New Year 2011 |
|
|
Hi Crome,
Pls share your view on 3i Infotech & NTPC.
Regards,
Chetan.
|
|
| Back to top |
|
|
chrome
Yellow Belt
Joined: 28 Dec 2009
Posts: 645
|
| Post: #9 Posted: Sat Jan 01, 2011 1:18 pm Post subject: Re: Happy New Year 2011 |
|
|
| chetan83 wrote: | Hi Crome,
Pls share your view on 3i Infotech & NTPC.
Regards,
Chetan. |
Hi Chetan. 3iinfotech as per my view can touch 65 in quick time. Not so bullish on NTPC though.
|
|
| Back to top |
|
|
chetan83
Brown Belt
Joined: 19 Feb 2010
Posts: 2037
|
| Post: #10 Posted: Sat Jan 01, 2011 1:34 pm Post subject: Re: Happy New Year 2011 |
|
|
| chrome wrote: | | chetan83 wrote: | Hi Crome,
Pls share your view on 3i Infotech & NTPC.
Regards,
Chetan. |
Hi Chetan. 3iinfotech as per my view can touch 65 in quick time. Not so bullish on NTPC though. |
Thanks for your prompt reply Crome 
|
|
| Back to top |
|
|
chetan83
Brown Belt
Joined: 19 Feb 2010
Posts: 2037
|
| Post: #11 Posted: Sat Jan 01, 2011 4:03 pm Post subject: Review |
|
|
D/Crome,
A nice set-up getting build up in Nev-lignite & Jindal Poly.....your review on this.....what can be the SL for short term longs?
|
|
| Back to top |
|
|
chrome
Yellow Belt
Joined: 28 Dec 2009
Posts: 645
|
| Post: #12 Posted: Wed Feb 02, 2011 5:20 pm Post subject: |
|
|
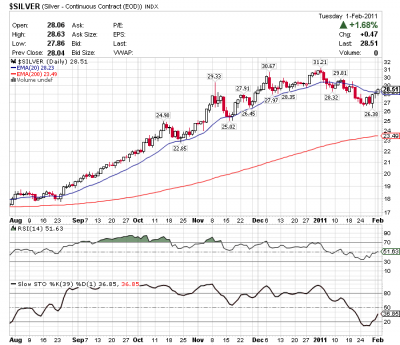
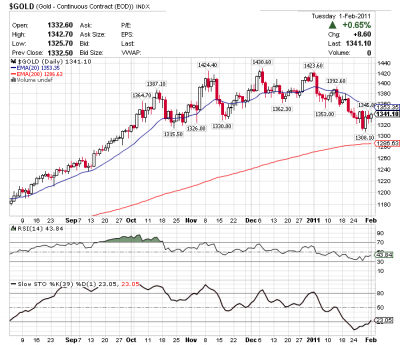
quick veiw on gold and silver....both are great buy at current levels (charts are in $ values)
| Description: |
|
| Filesize: |
27.07 KB |
| Viewed: |
820 Time(s) |
|
| Description: |
|
| Filesize: |
27.55 KB |
| Viewed: |
743 Time(s) |
|
|
|
| Back to top |
|
|
chrome
Yellow Belt
Joined: 28 Dec 2009
Posts: 645
|
|
| Back to top |
|
|
chrome
Yellow Belt
Joined: 28 Dec 2009
Posts: 645
|
| Post: #14 Posted: Wed Feb 09, 2011 9:49 pm Post subject: |
|
|
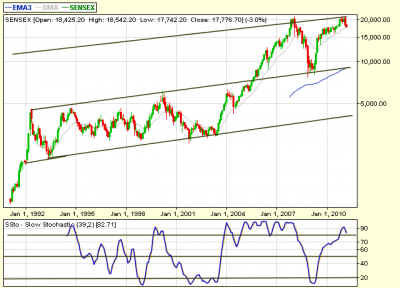
| chrome wrote: | Sensex long term chart (monthly candles)....simple parallel trend lines.....Can we go to hell again @ 9000 on Sensex if we close below 17500 in Feb-11......!!!!!!!!!
A wishfull thinking, but too early to predict !!!!!
 |
day low of 17508.35.......too near yet too low....awaiting a close below 17500 on sensex...........keep a check on this level on closing basis for further levels
|
|
| Back to top |
|
|
chrome
Yellow Belt
Joined: 28 Dec 2009
Posts: 645
|
| Post: #15 Posted: Sat Feb 12, 2011 12:36 pm Post subject: |
|
|
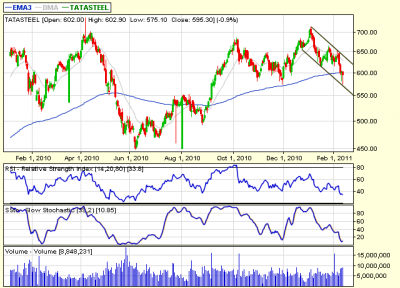
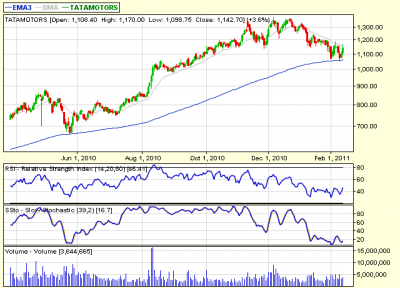
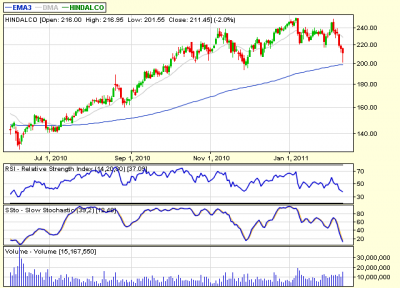
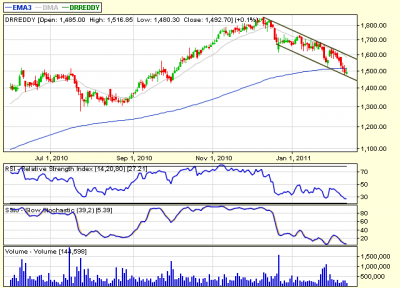
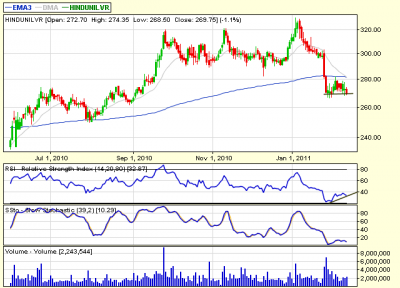
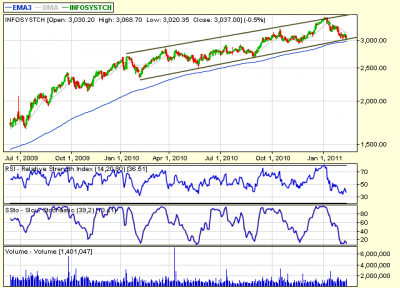
some bigies EOD charts...
TATASTEEL : weak only below 575 closing. Channel support (though downtrending) and 200 day EMA support also exist here...powerful if able to close above 600 for a couple of trading days.
TATAMOTORS - bouncing back twice from 200 day EMA and closing...Looking good to resume its uptrend.
HINDALCO - bouncing back from 200 day EMA with a long tail. Hope it also continues its uptrend.
DRREDDY - resisting and failed to close above 200 day EMA in two continuos trading days. Weak looking candidate below 1480.
HUL : base formation around 270 with +ve RSI divergence....very crucial levels....though strong resistance around 280 levels too...
INFY : 3000 crucial levels...support area...channel line and 200 day EMA...good support here to resume its continuous uptrend.
| Description: |
|
| Filesize: |
28.06 KB |
| Viewed: |
731 Time(s) |
|
| Description: |
|
| Filesize: |
24.41 KB |
| Viewed: |
727 Time(s) |
|
| Description: |
|
| Filesize: |
21.7 KB |
| Viewed: |
728 Time(s) |
|
| Description: |
|
| Filesize: |
23.38 KB |
| Viewed: |
711 Time(s) |
|
| Description: |
|
| Filesize: |
22.47 KB |
| Viewed: |
715 Time(s) |
|
| Description: |
|
| Filesize: |
30.92 KB |
| Viewed: |
719 Time(s) |
|
|
|
| Back to top |
|
|
|