| View previous topic :: View next topic |
| Author |
READING THE LINE [DAY TRADERS MIND] - FUTURES ONLY |
amitagg
Black Belt

Joined: 01 Oct 2013
Posts: 4559
|
Post: #676  Posted: Tue Mar 18, 2014 3:13 pm Post subject: Posted: Tue Mar 18, 2014 3:13 pm Post subject: |
 |
|
| amitagg wrote: | | amitagg wrote: | | Buying Zee above 280-281 for target 285.5/287/290....C&H....and moving into the "channel" on 30D given the monthly move within "channel" - see 3 charts attached...stop 275... |
went down purely "academic"...  wanted to trade but had entered NF and Yes bank in morning.....doing well currently at 284 midst down market......poised critically.... wanted to trade but had entered NF and Yes bank in morning.....doing well currently at 284 midst down market......poised critically.... |
|
|
| Back to top |
|
 |
|
|
 |
amitagg
Black Belt

Joined: 01 Oct 2013
Posts: 4559
|
Post: #677  Posted: Tue Mar 18, 2014 3:27 pm Post subject: Posted: Tue Mar 18, 2014 3:27 pm Post subject: |
 |
|
Closing for the day......had a plethora of mails [not mail exchanges] today.....
pls take positively....
Would request all Ichartians to give proper "buy" or "sell" direction and "SL" levels with each trade [ there need not be a SL for every trade remember]. If can post, give "exit" level also....
[Note: Looking at exit and when Sls hit is not a reflection of being right or wrong but trading success depends on learning from SL's / reasons behind them, etc. and actually "modifying our behaviour" to accept the "factual reality of market" and "need for more additional techniques, resources, and aptitude", so that we come better with each trade ]
Caveat: many time above cannot be given due to paucity of time , sometimes we forecast and market may not move in that way and then our view might change but we do not get time to post, etc.
Happy Trading.....
|
|
| Back to top |
|
 |
amitagg
Black Belt

Joined: 01 Oct 2013
Posts: 4559
|
Post: #678  Posted: Tue Mar 18, 2014 5:54 pm Post subject: Posted: Tue Mar 18, 2014 5:54 pm Post subject: |
 |
|
For 19th March
Buy NF "again " above 6564....target 6610 [approx.] [SL=6535] [closer stop can be 6550]
[today's trade = 40 points]
Reasons: i) move above 6464 means fall back into channel
ii) tick average price above 6564
iii) invertes H&S to make [incomplete pattern]
iv) above EMAs
v) held Pivot 6518 today
vi) 6652 [minium] target of EW from 5933 = 6125-5933+6450 [approx.]
vii) mentioned yesterday...RSi not overbought
simply buy....only statistics matter...[make own analysis....not crowd view]
|
|
| Back to top |
|
 |
amitagg
Black Belt

Joined: 01 Oct 2013
Posts: 4559
|
Post: #679  Posted: Wed Mar 19, 2014 9:46 am Post subject: Posted: Wed Mar 19, 2014 9:46 am Post subject: |
 |
|
| sold ITC at 358.5.....could not trade NF...now in sell
|
|
| Back to top |
|
 |
amitagg
Black Belt

Joined: 01 Oct 2013
Posts: 4559
|
Post: #680  Posted: Wed Mar 19, 2014 11:15 am Post subject: Posted: Wed Mar 19, 2014 11:15 am Post subject: |
 |
|
| amitagg wrote: | | sold ITC at 358.5.....could not trade NF...now in sell |
 stopped at hr high at 360.5... stopped at hr high at 360.5...
bought NF at 6566....stop 6535 days low....target open
|
|
| Back to top |
|
 |
amitagg
Black Belt

Joined: 01 Oct 2013
Posts: 4559
|
Post: #681  Posted: Wed Mar 19, 2014 11:23 am Post subject: Posted: Wed Mar 19, 2014 11:23 am Post subject: |
 |
|
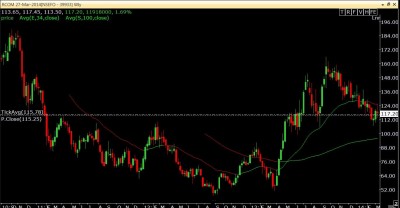
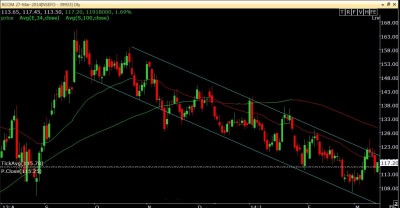
is rcom breaking out of channel and a buy....see 2 charts....not sound fundamentally and some put enterprise value at 108 etc....though..
| Description: |
|
| Filesize: |
159.47 KB |
| Viewed: |
153 Time(s) |

|
| Description: |
|
| Filesize: |
177.99 KB |
| Viewed: |
162 Time(s) |

|
|
|
| Back to top |
|
 |
amitagg
Black Belt

Joined: 01 Oct 2013
Posts: 4559
|
Post: #682  Posted: Wed Mar 19, 2014 1:11 pm Post subject: Posted: Wed Mar 19, 2014 1:11 pm Post subject: |
 |
|
| amitagg wrote: | | is rcom breaking out of channel and a buy....see 2 charts....not sound fundamentally and some put enterprise value at 108 etc....though.. |
watch Rcom chart and take own call...it is looking strong...traded in and out a while back since banking of NF up breakout in few days......
|
|
| Back to top |
|
 |
amitagg
Black Belt

Joined: 01 Oct 2013
Posts: 4559
|
Post: #683  Posted: Wed Mar 19, 2014 1:25 pm Post subject: Posted: Wed Mar 19, 2014 1:25 pm Post subject: |
 |
|
| amitagg wrote: | | amitagg wrote: | | is rcom breaking out of channel and a buy....see 2 charts....not sound fundamentally and some put enterprise value at 108 etc....though.. |
watch Rcom chart and take own call...it is looking strong...traded in and out a while back since banking of NF up breakout in few days...... |
another stock to watch for "low volatility trade" is Bharti Airtel....its started rreversing the multi week fall...an index one...and shall "slowly" inch upwards to 308...and then give a breakup.....current 300-301...... [pattern : false breakdown shown on intra day chart yesterday is bullish for today and possibly forming spike and channel with target 305 spot..]...close stop is 298.... risk reward good.
|
|
| Back to top |
|
 |
amitagg
Black Belt

Joined: 01 Oct 2013
Posts: 4559
|
Post: #684  Posted: Wed Mar 19, 2014 1:28 pm Post subject: Posted: Wed Mar 19, 2014 1:28 pm Post subject: |
 |
|
| amitagg wrote: | | amitagg wrote: | | amitagg wrote: | | is rcom breaking out of channel and a buy....see 2 charts....not sound fundamentally and some put enterprise value at 108 etc....though.. |
watch Rcom chart and take own call...it is looking strong...traded in and out a while back since banking of NF up breakout in few days...... |
another stock to watch for "low volatility trade" is Bharti Airtel....its started rreversing the multi week fall...an index one...and shall "slowly" inch upwards to 308...and then give a breakup.....current 300-301...... [pattern : false breakdown shown on intra day chart yesterday is bullish for today and possibly forming spike and channel with target 305 spot..]...close stop is 298.... risk reward good. |
bought Bharti at 301.5 with stop 298 target watch at 306/308 for pattern.....
|
|
| Back to top |
|
 |
amitagg
Black Belt

Joined: 01 Oct 2013
Posts: 4559
|
Post: #685  Posted: Wed Mar 19, 2014 1:35 pm Post subject: Posted: Wed Mar 19, 2014 1:35 pm Post subject: |
 |
|
i am clearly seeing a "bullish" Nifty pattern intra day today...which shall break on upside either today or nex few days......position yourself for the same.......
risk averse can buy NF and sell 6600 call....
or buy futures simply....
|
|
| Back to top |
|
 |
amitagg
Black Belt

Joined: 01 Oct 2013
Posts: 4559
|
Post: #686  Posted: Wed Mar 19, 2014 1:37 pm Post subject: Posted: Wed Mar 19, 2014 1:37 pm Post subject: |
 |
|
| amitagg wrote: | i am clearly seeing a "bullish" Nifty pattern intra day today...which shall break on upside either today or nex few days......position yourself for the same.......
risk averse can buy NF and sell 6600 call....
or buy futures simply.... |
buy yes bank and hold for few days....current 372
|
|
| Back to top |
|
 |
amitagg
Black Belt

Joined: 01 Oct 2013
Posts: 4559
|
Post: #687  Posted: Wed Mar 19, 2014 1:51 pm Post subject: Posted: Wed Mar 19, 2014 1:51 pm Post subject: |
 |
|
| amitagg wrote: | | amitagg wrote: | i am clearly seeing a "bullish" Nifty pattern intra day today...which shall break on upside either today or nex few days......position yourself for the same.......
risk averse can buy NF and sell 6600 call....
or buy futures simply.... |
buy yes bank and hold for few days....current 372 |
for Nifty, to widen the SLs since market may show a slight move below low and rise rapidly.......6506 NF can be better SL.......
|
|
| Back to top |
|
 |
amitagg
Black Belt

Joined: 01 Oct 2013
Posts: 4559
|
Post: #688  Posted: Wed Mar 19, 2014 2:29 pm Post subject: Posted: Wed Mar 19, 2014 2:29 pm Post subject: |
 |
|
| amitagg wrote: | | amitagg wrote: | | amitagg wrote: | i am clearly seeing a "bullish" Nifty pattern intra day today...which shall break on upside either today or nex few days......position yourself for the same.......
risk averse can buy NF and sell 6600 call....
or buy futures simply.... |
buy yes bank and hold for few days....current 372 |
for Nifty, to widen the SLs since market may show a slight move below low and rise rapidly.......6506 NF can be better SL....... |
this turned out true....lets wait for the second.....seeing SBI and Yes bank charts.....somehwat getting skeptical of rise......seeing more charts
|
|
| Back to top |
|
 |
amitagg
Black Belt

Joined: 01 Oct 2013
Posts: 4559
|
Post: #689  Posted: Wed Mar 19, 2014 2:41 pm Post subject: Posted: Wed Mar 19, 2014 2:41 pm Post subject: |
 |
|
setting is best for trap of shorts IF it has to happen
......below yesterday close
....lower lower lower highg formation on intra day
......sideways move all day [instead if down move].....
Note it : crossing 6530 spot would give indication....crossing 6540 spot would give "confirmation".......today levels..
for breakdown we have a SL in place. 
and time at 2.30 -3 pm odd is also right....
and i believe that such settings with 50-80 point up or down "cannot be predicted (mostly)"...but can only be positioned....
|
|
| Back to top |
|
 |
amitagg
Black Belt

Joined: 01 Oct 2013
Posts: 4559
|
Post: #690  Posted: Wed Mar 19, 2014 10:59 pm Post subject: Posted: Wed Mar 19, 2014 10:59 pm Post subject: |
 |
|
the 200 SMA on 15th and trendline from 5933 is at NF 6499/6500 currently ......break of this should make "positional longs early exit".....it shall be first break since 5933 if it happens and would signal move down to 6350
......for fresh longs, entry only above NF 6566
....for existing long like me, closer stop 6534 [low of last few 15tf candles - later ones were inside bars] and then 6516 [below previous days pivot / 6220-6225 price support].....
|
|
| Back to top |
|
 |
|

