| View previous topic :: View next topic |
| Author |
READING THE LINE [DAY TRADERS MIND] - FUTURES ONLY |
amitagg
Black Belt

Joined: 01 Oct 2013
Posts: 4559
|
Post: #691  Posted: Thu Mar 20, 2014 10:09 am Post subject: Posted: Thu Mar 20, 2014 10:09 am Post subject: |
 |
|
| amitagg wrote: | | amitagg wrote: | | amitagg wrote: | | amitagg wrote: | | is rcom breaking out of channel and a buy....see 2 charts....not sound fundamentally and some put enterprise value at 108 etc....though.. |
watch Rcom chart and take own call...it is looking strong...traded in and out a while back since banking of NF up breakout in few days...... |
another stock to watch for "low volatility trade" is Bharti Airtel....its started rreversing the multi week fall...an index one...and shall "slowly" inch upwards to 308...and then give a breakup.....current 300-301...... [pattern : false breakdown shown on intra day chart yesterday is bullish for today and possibly forming spike and channel with target 305 spot..]...close stop is 298.... risk reward good. |
bought Bharti at 301.5 with stop 298 target watch at 306/308 for pattern..... |
by sheer luck Bharti was up today and exited at 303.5
|
|
| Back to top |
|
 |
|
|
 |
amitagg
Black Belt

Joined: 01 Oct 2013
Posts: 4559
|
Post: #692  Posted: Thu Mar 20, 2014 10:13 am Post subject: Posted: Thu Mar 20, 2014 10:13 am Post subject: |
 |
|
| amitagg wrote: | the 200 SMA on 15th and trendline from 5933 is at NF 6499/6500 currently ......break of this should make "positional longs early exit".....it shall be first break since 5933 if it happens and would signal move down to 6350
......for fresh longs, entry only above NF 6566
....for existing long like me, closer stop 6534 [low of last few 15tf candles - later ones were inside bars] and then 6516 [below previous days pivot / 6220-6225 price support]..... |
exited at open at 6223....more than made up losses by buying 6500put at 39 and selling 43....first resistance.....likely it shall touch 47 today minimum......see the chart....break of sideways consol above 38 and hence touched 43......it can go up to 51 etc..
|
|
| Back to top |
|
 |
amitagg
Black Belt

Joined: 01 Oct 2013
Posts: 4559
|
Post: #693  Posted: Thu Mar 20, 2014 10:15 am Post subject: Posted: Thu Mar 20, 2014 10:15 am Post subject: |
 |
|
| amitagg wrote: | | amitagg wrote: | the 200 SMA on 15th and trendline from 5933 is at NF 6499/6500 currently ......break of this should make "positional longs early exit".....it shall be first break since 5933 if it happens and would signal move down to 6350
......for fresh longs, entry only above NF 6566
....for existing long like me, closer stop 6534 [low of last few 15tf candles - later ones were inside bars] and then 6516 [below previous days pivot / 6220-6225 price support]..... |
exited at open at 6223....more than made up losses by buying 6500put at 39 and selling 43 ....first resistance.....likely it shall touch 47 today minimum......see the chart....break of sideways consol above 38 and hence touched 43......it can go up to 51 etc.. |
was riskier trade though....
|
|
| Back to top |
|
 |
amitagg
Black Belt

Joined: 01 Oct 2013
Posts: 4559
|
Post: #694  Posted: Thu Mar 20, 2014 10:28 am Post subject: Posted: Thu Mar 20, 2014 10:28 am Post subject: |
 |
|
| amitagg wrote: | | amitagg wrote: | | is rcom breaking out of channel and a buy....see 2 charts....not sound fundamentally and some put enterprise value at 108 etc....though.. |
watch Rcom chart and take own call...it is looking strong...traded in and out a while back since banking of NF up breakout in few days...... |
rcom [up even today] and bharti should be watched....they are becoming position al buy candidates.....but wait for NS to stabilise over the next few days....
|
|
| Back to top |
|
 |
amitagg
Black Belt

Joined: 01 Oct 2013
Posts: 4559
|
Post: #695  Posted: Thu Mar 20, 2014 11:14 am Post subject: Posted: Thu Mar 20, 2014 11:14 am Post subject: |
 |
|
| bought HCl tech ....1422...stop 1385...target 1438/1456....a reversal pattern and IT packet.....
|
|
| Back to top |
|
 |
amitagg
Black Belt

Joined: 01 Oct 2013
Posts: 4559
|
Post: #696  Posted: Thu Mar 20, 2014 11:28 am Post subject: Posted: Thu Mar 20, 2014 11:28 am Post subject: |
 |
|
| when would 6487 break on spot......if at all......or 6542 break up.....
|
|
| Back to top |
|
 |
amitagg
Black Belt

Joined: 01 Oct 2013
Posts: 4559
|
Post: #697  Posted: Thu Mar 20, 2014 2:36 pm Post subject: Posted: Thu Mar 20, 2014 2:36 pm Post subject: |
 |
|
waiting to see whether NF 6500 goes on 30tf ...till then uptrend intact [ no trendline break since 5933]
| amitagg wrote: | | amitagg wrote: | | amitagg wrote: | the 200 SMA on 15th and trendline from 5933 is at NF 6499/6500 currently ......break of this should make "positional longs early exit".....it shall be first break since 5933 if it happens and would signal move down to 6350
......for fresh longs, entry only above NF 6566
....for existing long like me, closer stop 6534 [low of last few 15tf candles - later ones were inside bars] and then 6516 [below previous days pivot / 6220-6225 price support]..... |
exited at open at 6223....more than made up losses by buying 6500put at 39 and selling 43 ....first resistance.....likely it shall touch 47 today minimum......see the chart....break of sideways consol above 38 and hence touched 43......it can go up to 51 etc.. |
was riskier trade though.... |
|
|
| Back to top |
|
 |
amitagg
Black Belt

Joined: 01 Oct 2013
Posts: 4559
|
Post: #698  Posted: Fri Mar 21, 2014 3:28 pm Post subject: Posted: Fri Mar 21, 2014 3:28 pm Post subject: |
 |
|
still not broken.....
| amitagg wrote: | waiting to see whether NF 6500 goes on 30tf ...till then uptrend intact [ no trendline break since 5933]
| amitagg wrote: | | amitagg wrote: | | amitagg wrote: | the 200 SMA on 15th and trendline from 5933 is at NF 6499/6500 currently ......break of this should make "positional longs early exit".....it shall be first break since 5933 if it happens and would signal move down to 6350
......for fresh longs, entry only above NF 6566
....for existing long like me, closer stop 6534 [low of last few 15tf candles - later ones were inside bars] and then 6516 [below previous days pivot / 6220-6225 price support]..... |
exited at open at 6223....more than made up losses by buying 6500put at 39 and selling 43 ....first resistance.....likely it shall touch 47 today minimum......see the chart....break of sideways consol above 38 and hence touched 43......it can go up to 51 etc.. |
was riskier trade though.... |
|
|
|
| Back to top |
|
 |
amitagg
Black Belt

Joined: 01 Oct 2013
Posts: 4559
|
Post: #699  Posted: Sat Mar 22, 2014 12:12 am Post subject: Posted: Sat Mar 22, 2014 12:12 am Post subject: |
 |
|
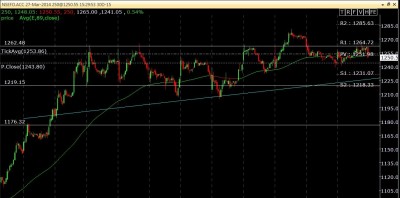
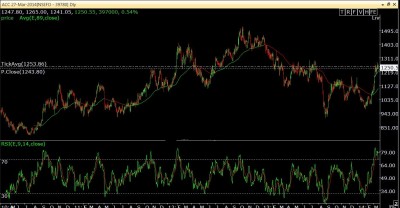
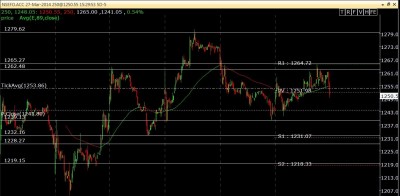
posting 3 charts of ACC [current price 1250 futures] action sell
- Long Term : resistance at 1285 + RSi divergence + bearish candlestick at top / multi month resistance
- 30D chart showing "breakout failure at 1265"....
- intra day chart showing late fall and inability to surpass 1265....
Sell ACC at any level for targets till 1232/1218/1170....sell on each rise also....stop 1285/1290....
low volatility scrip completing one leg of uptrend [sharp] and now likely to retrace down.......otherwise since RSI is in new territory it shall eventually break the multi month resistance of 1285.....
safe short perhaps...though nothing is 'safe'
| Description: |
|
| Filesize: |
177.26 KB |
| Viewed: |
171 Time(s) |

|
| Description: |
|
| Filesize: |
228.44 KB |
| Viewed: |
161 Time(s) |

|
| Description: |
|
| Filesize: |
180.16 KB |
| Viewed: |
158 Time(s) |

|
|
|
| Back to top |
|
 |
amitagg
Black Belt

Joined: 01 Oct 2013
Posts: 4559
|
Post: #700  Posted: Sat Mar 22, 2014 12:17 am Post subject: Posted: Sat Mar 22, 2014 12:17 am Post subject: |
 |
|
| amitagg wrote: | posting 3 charts of ACC [current price 1250 futures] action sell
- Long Term : resistance at 1285 + RSi divergence + bearish candlestick at top / multi month resistance
- 30D chart showing "breakout failure at 1265"....
- intra day chart showing late fall and inability to surpass 1265....
Sell ACC at any level for targets till 1232/1218/1200/ 1170....sell on each rise also....stop 1285/1290....
low volatility scrip completing one leg of uptrend [sharp] and now likely to retrace down.......otherwise since RSI is in new territory it shall eventually break the multi month resistance of 1285.....
safe short perhaps...though nothing is 'safe' |
|
|
| Back to top |
|
 |
amitagg
Black Belt

Joined: 01 Oct 2013
Posts: 4559
|
Post: #701  Posted: Sat Mar 22, 2014 12:01 pm Post subject: Posted: Sat Mar 22, 2014 12:01 pm Post subject: |
 |
|
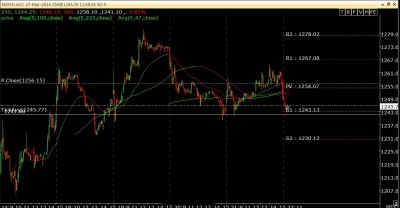
current chart attached.....H&S shall break it seems.....a sell then...also heavier volumes in right shoulder....
shorted at 1248 stop 1268.....
| amitagg wrote: | | amitagg wrote: | posting 3 charts of ACC [current price 1250 futures] action sell
- Long Term : resistance at 1285 + RSi divergence + bearish candlestick at top / multi month resistance
- 30D chart showing "breakout failure at 1265"....
- intra day chart showing late fall and inability to surpass 1265....
Sell ACC at any level for targets till 1232/1218/1200/ 1170....sell on each rise also....stop 1285/1290....
low volatility scrip completing one leg of uptrend [sharp] and now likely to retrace down.......otherwise since RSI is in new territory it shall eventually break the multi month resistance of 1285.....
safe short perhaps...though nothing is 'safe' |
|
| Description: |
|
| Filesize: |
183.53 KB |
| Viewed: |
155 Time(s) |

|
|
|
| Back to top |
|
 |
rk_a2003
Black Belt

Joined: 21 Jan 2010
Posts: 2734
|
Post: #702  Posted: Sat Mar 22, 2014 12:16 pm Post subject: Posted: Sat Mar 22, 2014 12:16 pm Post subject: |
 |
|
| amitagg wrote: | current chart attached.....H&S shall break it seems.....a sell then...also heavier volumes in right shoulder....
shorted at 1248 stop 1268.....
| amitagg wrote: | | amitagg wrote: | posting 3 charts of ACC [current price 1250 futures] action sell
- Long Term : resistance at 1285 + RSi divergence + bearish candlestick at top / multi month resistance
- 30D chart showing "breakout failure at 1265"....
- intra day chart showing late fall and inability to surpass 1265....
Sell ACC at any level for targets till 1232/1218/1200/ 1170....sell on each rise also....stop 1285/1290....
low volatility scrip completing one leg of uptrend [sharp] and now likely to retrace down.......otherwise since RSI is in new territory it shall eventually break the multi month resistance of 1285.....
safe short perhaps...though nothing is 'safe' |
|
|
I took up this trade Amit...Thanks
|
|
| Back to top |
|
 |
amitagg
Black Belt

Joined: 01 Oct 2013
Posts: 4559
|
Post: #703  Posted: Sat Mar 22, 2014 12:27 pm Post subject: Posted: Sat Mar 22, 2014 12:27 pm Post subject: |
 |
|
| rk_a2003 wrote: | | amitagg wrote: | current chart attached.....H&S shall break it seems.....a sell then...also heavier volumes in right shoulder....
shorted at 1248 stop 1268.....
| amitagg wrote: | | amitagg wrote: | posting 3 charts of ACC [current price 1250 futures] action sell
- Long Term : resistance at 1285 + RSi divergence + bearish candlestick at top / multi month resistance
- 30D chart showing "breakout failure at 1265"....
- intra day chart showing late fall and inability to surpass 1265....
Sell ACC at any level for targets till 1232/1218/1200/ 1170....sell on each rise also....stop 1285/1290....
low volatility scrip completing one leg of uptrend [sharp] and now likely to retrace down.......otherwise since RSI is in new territory it shall eventually break the multi month resistance of 1285.....
safe short perhaps...though nothing is 'safe' |
|
|
I took up this trade Amit...Thanks |
i actually dont like such scrips [since they behave irrationally may be] for trading purposes in my trading style and may therefore exit on spike down to 1232 etc..without waiting for lower targets....since market also not confirming a breakdown?....and any reversal in market would push all scrips higher....
|
|
| Back to top |
|
 |
rk_a2003
Black Belt

Joined: 21 Jan 2010
Posts: 2734
|
Post: #704  Posted: Sat Mar 22, 2014 12:36 pm Post subject: Posted: Sat Mar 22, 2014 12:36 pm Post subject: |
 |
|
| True, Amit.I am sensing some correction in the market.That's another reason for taking up this trade.I shorted April series.
|
|
| Back to top |
|
 |
vinay28
Black Belt

Joined: 24 Dec 2010
Posts: 11748
|
Post: #705  Posted: Sat Mar 22, 2014 12:37 pm Post subject: Posted: Sat Mar 22, 2014 12:37 pm Post subject: |
 |
|
| rk_a2003 wrote: | | True, Amit.I am sensing some correction in the market.That's another reason for taking up this trade.I shorted April series. |
I am not sure that's a correct decision
|
|
| Back to top |
|
 |
|

