| View previous topic :: View next topic |
| Author |
RELIANCE IND LTD @ NSE (RECENT PATTERN) |
ipakrashi
White Belt

Joined: 09 Jul 2009
Posts: 16
|
Post: #1  Posted: Sat Aug 08, 2009 1:47 am Post subject: RELIANCE IND LTD @ NSE (RECENT PATTERN) Posted: Sat Aug 08, 2009 1:47 am Post subject: RELIANCE IND LTD @ NSE (RECENT PATTERN) |
 |
|
Hi guys ,
This is in response to SSKI's take on Reliance Industries Limited on NSE.
He Points out that RELIANCE IND has become "BEARISH" and recommends to sell it but doesn’t have a proper contention to his views.
Well as all the stocks has been BEARISH leading to the last few days sell off.
The market looks for a correction which is overdue following the frantic rally.
A close look at the Reliance Industries Charts reveal the following:
1. The Stock right now is facing a downtrend which is confirmed by the loss of price.
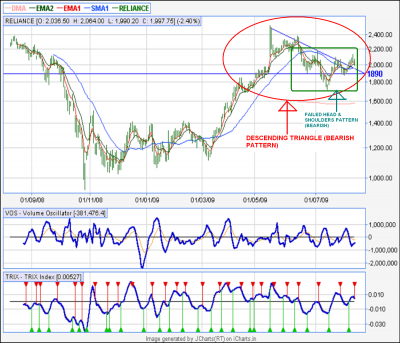
2. There is a "Descending Triangle" formation which is BEARISH as per many Technical Analysts (Refer to the Adjoining Chart circled in RED),
however since the price has not hit (or aptly said “breached”) the downward sloping trendline and the convergence of the trendline with the support level of 1890, we cannot confirm that there is immediate “Bearishness”
3. The recent pattern also shows an Inverted “Head & Shoulders Pattern” which is “BULLISH” as per many technical analysts (Refer to the Adjoining Chart Squared in GREEN) but that Inverted Head and shoulders pattern surely looks to be a failure ie a failed Inverted Head & Shoulders Pattern.
4. Therefore it may be said that the stock is surely in a Trading Range of 1890-2100. and is showing signs of “Whipsaw” movement more commonly known as a “rectangle pattern” in technical analysis.
5. A study of the F&O option of the stock reveals that the price is declining with open interest contracts increasing, this indicates that new short positions are being opened. As long as this process continues it is a “BEARISH” factor, but once the shorts begin to cover it turns bullish
In my opinion there is no doubt that the stock is showing signs of BEARISHNESS in more quarters than one, however since the stock is not near its converging trendline support level of 1890 I cannot confirm the completion of the “Descending Triangle” formation, Again there is a presence of an “inverted head and shoulders pattern” however failed it might be, which gives us a possibility of a bounce back but F&O data is confirming the opening of short positions, Therefore in my opinion I would ask readers to wait and watch the level of 1890 to be breached on the downside to exit the stock otherwise the stock has the potential to bounce back
HOWEVER THE TRENDS ARE OVERTLY “EARLY BEARISH”
Please take a conscious decision regarding this stock.
Thanks
Indranil
(PS: “Class” please review, you are the best person around)
| Description: |
|
| Filesize: |
440.45 KB |
| Viewed: |
728 Time(s) |
|
| Description: |
|

Download |
| Filename: |
RELIANCE F&O.doc |
| Filesize: |
53 KB |
| Downloaded: |
748 Time(s) |
|
|
| Back to top |
|
 |
|
| |
SSKI
White Belt
Joined: 21 Jul 2009
Posts: 10
|
| Post: #2 Posted: Sat Aug 08, 2009 8:48 am Post subject: RELIANCE CHARTS POSTED BY SSKI |
|
|
THIS IS IN RESPONSE TO VIEWS POSTED BY IPAKRASHI ABOUT RELIANCE.I WOULD LIKE TO BRING YOUR/VIEWERS NOTICE THE FOLLOWING POINTS WITH RESPONSE TO THE SAME IN ORDER-
1.I AGREE
2.I ALWAYS FIND THAT PATTERNS FOLLOW OSCILLATORS AND MY ANALYSIS IS BASED ON OSCILATORS ONLY.
3.NO COMMENT
4.NO COMMENT
5.HERE IS THE BLUNDER MISTAKE IN ANALYSING F&O DATA.WHEN PRICE DECLINES AND OPEN INTEREST INCREASES IT'S A BEARISH SIGN.SELL THE STOCKS AND VICE-VERSA.
THANKS A LOT FOR YOUR POINTS TO STRENGTHEN MY STOCK CHARTING PATERN.
|
|
| Back to top |
|
|
|
|
You cannot post new topics in this forum
You cannot reply to topics in this forum
You cannot edit your posts in this forum
You cannot delete your posts in this forum
You cannot vote in polls in this forum
You can attach files in this forum
You can download files in this forum
|
Powered by phpBB © 2001, 2005 phpBB Group
|
|


