| View previous topic :: View next topic |
| Author |
RSEX strategy - posted on popular demand |
taruntm
White Belt

Joined: 14 Jan 2009
Posts: 4
|
Post: #16  Posted: Tue Feb 10, 2009 6:18 pm Post subject: Entry Confirmation, SL, Target for RSEX : Excerpt from SB Posted: Tue Feb 10, 2009 6:18 pm Post subject: Entry Confirmation, SL, Target for RSEX : Excerpt from SB |
 |
|
This is an excerpt of a conversation on the SB. Read from bottom, up. Hope it helps other beginners like me 
-Tarun
| Quote: |
Stockhunter : yeah Sesha it works on 10 mins as well... but i cant give my '20 trade' challenege on that 4 rangebound days will eat up 20 trades in no time on 10 mins TF
Stockhunter : Tarun... Weekly/EOD/hourly/30 mins .. i have tried everything ... but dont believe on what i say .. pull up the charts and see yourself mate!
taruntm : it should be more reliable as Tf increases... have you tried this with EOD ??
seshareddy : Stockhunter 10 TF also looking good
taruntm : ok...
Stockhunter : Tarun.... it works ... but i cant give you '20 trade' challenge on that
Stockhunter : on Nifty.. trade size 2 lots rakho.. book one lot whenever you get 50 points.. let the other one run until crossover happens again .. enter in the direction of crossover again with 2 lots.. repeat process 20 timnes and let me know if you have a loss !!
taruntm : ohh...RSEX is not that reliable in 10 min Tf ?
Stockhunter : this is only for 30 mins and above time frame !
Stockhunter : just follow the crossovers blindly yaar ... after 20 blind trades if the net result is loss I will stop talking about RSEX
taruntm : ok
Stockhunter : tarun.. to keep it dead simple.. here the SL is crossover...
taruntm : SH..what about SL?? how do you decide? or is it same.. around 10 pts??
Stockhunter : instead to search for the holy grail they do opposite.. one small profit day.. one breakeven day.. and one big losing day
Stockhunter : rsex is the simplest tool i believe for newbies who are not interested in catching exact tops/bottoms but make consistent money ... one small losing day, one breakeven day and one big profit day is what it takes
Stockhunter : wokay
taruntm : yes, im copy pasting this convo there so that it will help others.
Stockhunter : anyways.. just thought to post these in forum to keep my topic alive on RSEX
taruntm : ohhhh
Stockhunter : arey EMA of the RSI .. the slow line on RSEX.. the yellow one
taruntm : Also, you mentioned trade in direction of EMA.. EMA number?
Stockhunter : Tarun.. remember what i told you to try and trade in the direction of the EMA
taruntm : ok..SL should be how many pts?
Stockhunter: tarun... told you kiss and bounce back is the safest place to enter sith small SL .. or you can wait for next candle to see if its bouncing or not
taruntm : nifty btw..
taruntm : SH.. when RSEX is about to crossover, I see you have longed at certain points (you explained the kiss and bounce phenomenon in the mail)... but how do you decide that it isnt an actual crossover and the prices will fall ??   |
Last edited by taruntm on Tue Feb 10, 2009 6:28 pm; edited 1 time in total |
|
| Back to top |
|
 |
|
|
 |
taruntm
White Belt

Joined: 14 Jan 2009
Posts: 4
|
Post: #17  Posted: Tue Feb 10, 2009 6:27 pm Post subject: Email from Stockhunter, detailing RSEX. Posted: Tue Feb 10, 2009 6:27 pm Post subject: Email from Stockhunter, detailing RSEX. |
 |
|
I'm also posting an email SH sent to me, detailing RSEX. Again, I hope this helps somebody who is new to all this, like it has helped me.
All thanks to the one and only StockHunter!!!
| Quote: |
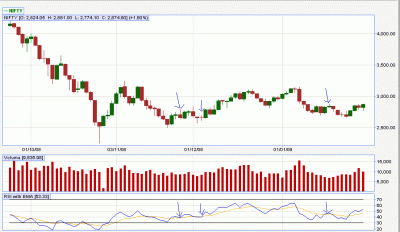
attaching a screenshot of Nifty EOD candles with the RSEX indicator (default values). However before anything, I wanted to tell you that i do not use RSEX for my basic trading, its just a tool I use to confirm whether I am in the right direction or not. I often, end up taking a position against RSEX and later when RSEX turns in my favour I relax and hold my positions until my target is met. Like currenlty if you see RSEX you will see it is clearly bullish right now however I am short, hence if RSEX doesnt turn in my favour on Monday I will have to exit shorts and wait for right levels to go long.
Anyways coming back to RSEX, i strongly believe it can be used as a stand alone tool by traders and still earn decent profits. RSEX is nothing but RSI (the blue line on my attachment) compared with its own EMA (the yellow line). Hence the triggers are crossovers, bullish and brearish. However there are whipsaws, but much less than any other indicator.
My self drafted two basic rules to avoid whipsaws are:
Rule 1. Always trade in the direction of underlying EMA to avoid false crossovers. Hence if the underlying EMA has been rising from an oversold zone, do not short immidiately at a crossover. Often the RSI will cross bullishly again next day and both lines will start to go north .. the bullish crossover is much safer in this scenario to trade then the bearish. Only exception to above is rule 2 below.
Rule 2. Trade immediately on a crossover when the crossover happens in the overbought zone ( trade on each bearish crossover) or is oversold zone (trade on each bullish crossover)
Now the trick is to get a 'small risk entry' in the direction of EMA. That can be taken when the RSI retraces back to EMA and moves back again in the direction of EMA ... I think this is what you wanted to understand.
To clarify, I have attached the screenshort as an example. I have put 3 arrows on RSEX besides the three corresponding arrows on the EOD candles. The first two have bullish RSEX set up, the RSI has come back to kiss the EMA where the arrows are placed. At this point either a bearish crossover can happen next day if markets close in negative (however wont be tradeable as per rule 1 above) or we can have a bullish day next day meaning 'kiss and move back' of RSI in the direction of EMA.. this is the place when one can enter a long trade next day... If you see .. this is exactly what happened next day in these cases and were good points to open longs.
The third arrow shows a bearish set up where next day when markets fell a short trade could have been opened.
Looking at current scenario, as i said above, RSEX is bullish and I am short ... what fun!!
Hope this helps...
Cheers
SH |
Another Email :
| Quote: |
Regarding RSEX, my seeting is 21,9. To avoid whipsaw, try trading in the direction of the EMA i.e enter whenever the RSI retraces back to EMA and bounces back from it. Dont enter immediately after the crossover if you want to trade high probability trades. |
| Description: |
|
| Filesize: |
17.65 KB |
| Viewed: |
1461 Time(s) |

|
|
|
| Back to top |
|
 |
TradeHunter
White Belt

Joined: 29 Jan 2009
Posts: 17
|
Post: #18  Posted: Wed Feb 11, 2009 7:01 pm Post subject: Trading made easy with RSEX... Posted: Wed Feb 11, 2009 7:01 pm Post subject: Trading made easy with RSEX... |
 |
|
RSEX is really a cool strategy......im trading intraday 30 min with only RSEX...and works well.....
Thank you...SH ji......
|
|
| Back to top |
|
 |
Stockhunter
White Belt

Joined: 10 Jun 2008
Posts: 193
|
Post: #19  Posted: Wed Feb 11, 2009 7:51 pm Post subject: . Posted: Wed Feb 11, 2009 7:51 pm Post subject: . |
 |
|
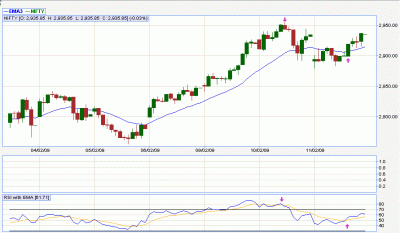
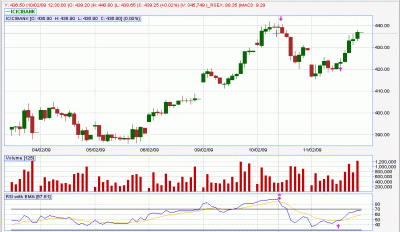
Continuing the RSEX post on Nifty and ICICI... ... attached is how NIfty and ICICI behaved today.. clearly both of last two signals have given good money ... and the current bullish signal is still working.. and counting!!
No Gann, no Fibo, no Pivots, no EW, no magik numbers, no CNBC, no paid subscriptions, no blogs, No Amibrokers, No Metastocks, No hi-fi books .. nothing required if you use RSEX (30 mins or above) with some patience and self descipline.
People who are still skeptical - Try paper trades for next 30 days and let me know the results.
Cheers
SH
| Description: |
|
| Filesize: |
15.79 KB |
| Viewed: |
1179 Time(s) |

|
| Description: |
|
| Filesize: |
20.18 KB |
| Viewed: |
962 Time(s) |

|
|
|
| Back to top |
|
 |
vinst
Black Belt

Joined: 09 Jan 2007
Posts: 3303
|
Post: #20  Posted: Thu Feb 12, 2009 8:46 am Post subject: Posted: Thu Feb 12, 2009 8:46 am Post subject: |
 |
|
SH,
Why the sell signal should not have been taken as indicated at 'A'?
regards,
vin
| Description: |
|
| Filesize: |
19.64 KB |
| Viewed: |
1218 Time(s) |
![ScreenHunter_02 Feb[1]. 11 14.08.gif](files/thumbs/t_screenhunter_02_feb1_11_1408_110.gif)
|
|
|
| Back to top |
|
 |
Stockhunter
White Belt

Joined: 10 Jun 2008
Posts: 193
|
Post: #21  Posted: Thu Feb 12, 2009 9:25 am Post subject: Posted: Thu Feb 12, 2009 9:25 am Post subject: |
 |
|
Vinst - good question.
It should have been taken and held even when Nifty was going up since the RSEX was still coming down. More shorts should have been added at higher 'kiss and bounce points' highlighted by my pink down arrow.
This is the classic divergence case in RSEX which you have highlighted and see the ensuing fall???
Cheers
SH
|
|
| Back to top |
|
 |
TradeHunter
White Belt

Joined: 29 Jan 2009
Posts: 17
|
Post: #22  Posted: Thu Feb 12, 2009 11:54 am Post subject: 20 EMA Posted: Thu Feb 12, 2009 11:54 am Post subject: 20 EMA |
 |
|
SH ji,u hav told dat u use 20 EMA with RSEX...is is for confirmation of direction or looking for alignment of both?say for ex price above EMA and bullish crosover in RSEX?
pls reply thank u...
|
|
| Back to top |
|
 |
TradeHunter
White Belt

Joined: 29 Jan 2009
Posts: 17
|
Post: #23  Posted: Thu Feb 12, 2009 12:04 pm Post subject: why this combination works? Posted: Thu Feb 12, 2009 12:04 pm Post subject: why this combination works? |
 |
|
1)good combo of indicators is to use a leading indicator with lagging indicator...this has RSI(leading)EMA(lagging)...that to in a single window...
2)it may be due to the boundness from 0-100...overbought/oversold levels
3)direction of momentum...
i think im rite....
|
|
| Back to top |
|
 |
Stockhunter
White Belt

Joined: 10 Jun 2008
Posts: 193
|
Post: #24  Posted: Thu Feb 12, 2009 7:02 pm Post subject: Posted: Thu Feb 12, 2009 7:02 pm Post subject: |
 |
|
TradeHunter/Sundar, you have answered your own questions and you even know you are right .. who am i to contradict?
Cheers
SH
|
|
| Back to top |
|
 |
TradeHunter
White Belt

Joined: 29 Jan 2009
Posts: 17
|
Post: #25  Posted: Fri Feb 13, 2009 11:17 am Post subject: a small update on RSEX Posted: Fri Feb 13, 2009 11:17 am Post subject: a small update on RSEX |
 |
|
frnds LINE charts are looking good when used with RSEX....just take a look at some charts,really amazing.....i
thank you frnds....
happy trading....
|
|
| Back to top |
|
 |
MR.WIN WIN
White Belt

Joined: 18 Feb 2009
Posts: 1
|
Post: #26  Posted: Wed Feb 18, 2009 11:33 am Post subject: nil Posted: Wed Feb 18, 2009 11:33 am Post subject: nil |
 |
|
stock hunter,
do you use RSEX or any other strategy?
pls do reply
|
|
| Back to top |
|
 |
TradeHunter
White Belt

Joined: 29 Jan 2009
Posts: 17
|
Post: #27  Posted: Thu Feb 19, 2009 11:35 am Post subject: reply Posted: Thu Feb 19, 2009 11:35 am Post subject: reply |
 |
|
mr.win-win he uses many things together and rsex is is one of them.....but u can follow it as a stanalone tool........
thankyou
|
|
| Back to top |
|
 |
TradeHunter
White Belt

Joined: 29 Jan 2009
Posts: 17
|
Post: #28  Posted: Thu Feb 19, 2009 7:17 pm Post subject: small update Posted: Thu Feb 19, 2009 7:17 pm Post subject: small update |
 |
|
guyz heres another update.....rsex is best when used in 60min,line chart,with past 6 trading days data, this timeframe showing the best price movement......no whipsaws nothing...very importantly low risk traders can use this...(intraday traders).....
this is used by me....
happy trading....
|
|
| Back to top |
|
 |
bhuvikarthi
White Belt

Joined: 19 Jul 2008
Posts: 7
|
Post: #29  Posted: Thu Feb 19, 2009 11:24 pm Post subject: Posted: Thu Feb 19, 2009 11:24 pm Post subject: |
 |
|
Dear SH,
Where can i find RSEX?
Please help me
|
|
| Back to top |
|
 |
kishy99
White Belt

Joined: 10 Feb 2009
Posts: 13
|
Post: #30  Posted: Fri Feb 20, 2009 10:30 am Post subject: Rsex Indicator Posted: Fri Feb 20, 2009 10:30 am Post subject: Rsex Indicator |
 |
|
Hi Bhuvikarthi,
You can find Rsex indicator on Icharts. At the top left corner there is a drop down, where u can select this indicator
|
|
| Back to top |
|
 |
|

