| View previous topic :: View next topic |
| Author |
RSEX strategy - posted on popular demand |
Trade Master
White Belt

Joined: 27 Apr 2009
Posts: 44
|
Post: #166  Posted: Sun May 03, 2009 9:22 pm Post subject: Reliance Capital Technical Analysis based on RSEX Posted: Sun May 03, 2009 9:22 pm Post subject: Reliance Capital Technical Analysis based on RSEX |
 |
|
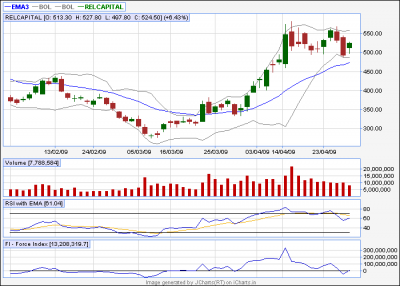
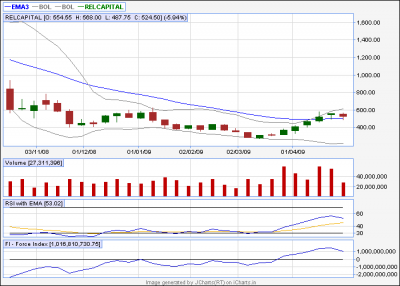
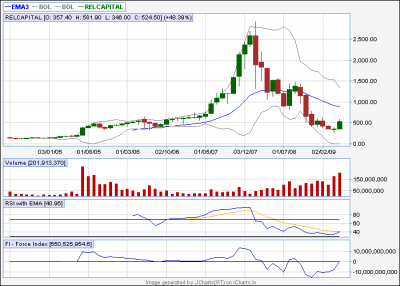
Posting 3 Different charts for Reliance Capital. 1.)Monthly, 2.)Weekly, and 3.)Daily EOD.
--On Daily EOD Charts, Can touch 540-545 in a couple of days but RSI is now on downward trend so expecting a downside journey of it.
--On Weekly basis, Can cool off a bit for sure as RSEX kiss on downside is expected, also Force Index need to cool down now.
--BUT BUT   check the Monthly charts. RSEX is going to break out from down channel and if the kiss is sustained (Around 500 levels) this month, an upward move is on the cards for RCAP. Force index is also crossing important Zero level at these levels.. check the Monthly charts. RSEX is going to break out from down channel and if the kiss is sustained (Around 500 levels) this month, an upward move is on the cards for RCAP. Force index is also crossing important Zero level at these levels..
Would like to read comments on the post from readers.
Thanks in Advance.
| Description: |
|
| Filesize: |
18.04 KB |
| Viewed: |
778 Time(s) |

|
| Description: |
|
| Filesize: |
14.94 KB |
| Viewed: |
722 Time(s) |

|
| Description: |
|
| Filesize: |
15.96 KB |
| Viewed: |
689 Time(s) |

|
|
|
| Back to top |
|
 |
|
|
 |
Stockhunter
White Belt

Joined: 10 Jun 2008
Posts: 193
|
Post: #167  Posted: Tue May 05, 2009 6:43 pm Post subject: Posted: Tue May 05, 2009 6:43 pm Post subject: |
 |
|
| Makhijani wrote: | Hi SH,
I went through this entire topic today. This is another great strategy which is definitely worth adopting. I have two questions -
1. You have mentioned to keep the SL small to minimise losses. Can you be more specific, say for NF intraday as well as on EOD basis?
2. I came across one post which pointed out bullish/bearish crossovers for several scrips on the same day. Does JCharts(EOD) have a stockscreener facility or does one have to check out different scrips according to one's liking?
Hope to hear from you for this one and also my earlier post today.
Cheers,
Makhijani |
Hi Makhijani,
With context to RSEX, when I say keep SL small I mean trade immediately after the crossover so that if a reverse crossover happens the SL stays small.
I dont think there is a stock screener here to check for RSEX crossovers, if we can have one it will be my most coveted and used tool (is ST listening??) 
Cheers
SH
|
|
| Back to top |
|
 |
Stockhunter
White Belt

Joined: 10 Jun 2008
Posts: 193
|
Post: #168  Posted: Tue May 05, 2009 6:48 pm Post subject: Posted: Tue May 05, 2009 6:48 pm Post subject: |
 |
|
| Makhijani wrote: | Hi SH!,
Your posts are often godsends. Just like this one. I have been seesawing between shorts and longs for the last ten days or so and now I am finally holding only shorts. But trying to figure out whether the market is more likely to breakout upwards or reverse direction so that I can position myself correctly.
I see the negative RSI divergence - thanks. Can we give more weightage to this than to the fact that the Nifty is making repeated attempts to breakout above the 3520-3530 levels? Is there any other factor that I should also be checking?
Cheers,
Makhijani |
Makhijani - the truth about divergences are that they need a lot of patience.. and often price will continue to make higher highs while indicators would be giving negative divergences. The way I look at divergences is that its always good to go long if price dictates so however add some puts to hedge the risk of the free fall. and once a free fall comes go short until the indicators are not equally oversold...
Right now Nifty is making higher highs... and I am carrying puts in my portfolio!! and waiting while I continue to follow price and go long in Nifty/Stocks.
Cheers
SH
|
|
| Back to top |
|
 |
RKM
White Belt

Joined: 06 Apr 2009
Posts: 137
|
Post: #169  Posted: Tue May 05, 2009 7:43 pm Post subject: Posted: Tue May 05, 2009 7:43 pm Post subject: |
 |
|
Hi SH,
Thanks for your eagerly awaited responses to all my queries.
Best wishes,
Makhijani
|
|
| Back to top |
|
 |
Stockhunter
White Belt

Joined: 10 Jun 2008
Posts: 193
|
Post: #170  Posted: Fri May 08, 2009 4:59 pm Post subject: RSEX current signal Posted: Fri May 08, 2009 4:59 pm Post subject: RSEX current signal |
 |
|
RSEX on EOD given another sell today and coupled with previous divergences visible on the charts there is a possibility that the fall can be cruel...
I say possibility and not certainity becuase the undertone is still bullish and the closing hasnt been convincing...
Cheers
SH
|
|
| Back to top |
|
 |
RKM
White Belt

Joined: 06 Apr 2009
Posts: 137
|
Post: #171  Posted: Sun May 10, 2009 12:37 pm Post subject: Posted: Sun May 10, 2009 12:37 pm Post subject: |
 |
|
Hi SH,
1. Please refer to your latest post. When would you act upon the EOD sell signal - ie. what kind of confirmation would you wait for before actually taking action?
2. Your initial posts in this thread give examples of using intraday RSEX for swing trading. Can we use EOD RSEX signals alone for positional trades or should they be supplemented by intraday RSEX signals or some other indicator?
3. How do you select/screen the stocks for trading? Do you have some preferences or do you use some other criteria?
Hope the divergences bear fruit this time.
Cheers,
Makhijani
|
|
| Back to top |
|
 |
vinst
Black Belt

Joined: 09 Jan 2007
Posts: 3303
|
Post: #172  Posted: Sun May 10, 2009 8:55 pm Post subject: Posted: Sun May 10, 2009 8:55 pm Post subject: |
 |
|
Hi,
I can screen for Rsex EOD as I have my own codes and post here. Only problem is that my scrips are limited to about 300. even that should be enough.
regards,
vin
|
|
| Back to top |
|
 |
RKM
White Belt

Joined: 06 Apr 2009
Posts: 137
|
Post: #173  Posted: Sun May 10, 2009 10:16 pm Post subject: Posted: Sun May 10, 2009 10:16 pm Post subject: |
 |
|
Hi Vin,
300 scrips are certainly more than enough. Are you using some other charting software?
Best wishes,
Makhijani
|
|
| Back to top |
|
 |
Stockhunter
White Belt

Joined: 10 Jun 2008
Posts: 193
|
Post: #174  Posted: Mon May 11, 2009 4:13 pm Post subject: Posted: Mon May 11, 2009 4:13 pm Post subject: |
 |
|
| Makhijani wrote: | Hi SH,
1. Please refer to your latest post. When would you act upon the EOD sell signal - ie. what kind of confirmation would you wait for before actually taking action?
2. Your initial posts in this thread give examples of using intraday RSEX for swing trading. Can we use EOD RSEX signals alone for positional trades or should they be supplemented by intraday RSEX signals or some other indicator?
3. How do you select/screen the stocks for trading? Do you have some preferences or do you use some other criteria?
Hope the divergences bear fruit this time.
Cheers,
Makhijani |
Makhijani -
1. a follower of RSEX should have sold at Friday's close immediately when on EOD the sell signal was confirmed (I mean near market closing time). Today Nifty gapped up but quickly gave up all gains to close 1.90% down....
2. I always suggest to stick to one time frame... so one should either stick to EOD or to intra days time frames (30 mins or 60 mins) only. Dont try and mix both to keep things simple.
3. I dont have a stock screener .. I just track 10 odd highly liquid stocks including NIfty and Bank Nifty .. thats enough I guess.
Cheers
SH
|
|
| Back to top |
|
 |
Stockhunter
White Belt

Joined: 10 Jun 2008
Posts: 193
|
Post: #175  Posted: Mon May 11, 2009 4:14 pm Post subject: Posted: Mon May 11, 2009 4:14 pm Post subject: |
 |
|
| vinst wrote: | Hi,
I can screen for Rsex EOD as I have my own codes and post here. Only problem is that my scrips are limited to about 300. even that should be enough.
regards,
vin |
Vinst - please do post your scrips where whenever you see a buy or sell signal on RSEX EOD .. I will consider a favour from you if you could do that.
Cheers
SH
|
|
| Back to top |
|
 |
Stockhunter
White Belt

Joined: 10 Jun 2008
Posts: 193
|
Post: #176  Posted: Tue May 12, 2009 8:34 pm Post subject: Posted: Tue May 12, 2009 8:34 pm Post subject: |
 |
|
RSEX on EOD closed in kiss mode... bullish crossover hasnt happened and hence as per one of my previous posts today's closing could have been used for a low risk short entries.
Cheers
SH
|
|
| Back to top |
|
 |
vinst
Black Belt

Joined: 09 Jan 2007
Posts: 3303
|
Post: #177  Posted: Wed May 13, 2009 9:33 am Post subject: Posted: Wed May 13, 2009 9:33 am Post subject: |
 |
|
SH,
Monthly Rsex buys:
--------------------
Amtek auto, advani oerlikon, automotive axles, divi's lab, graphite india, allahabad bank, motherson sumi, orchid chem, IDFC, orient hotel, Igate.
|
|
| Back to top |
|
 |
k_jeevan2003
White Belt

Joined: 22 Mar 2009
Posts: 55
|
Post: #178  Posted: Sun May 17, 2009 12:19 pm Post subject: Hai SH Posted: Sun May 17, 2009 12:19 pm Post subject: Hai SH |
 |
|
Hai SH goodafternoon..
I am the new subscriber in I charts for past 1 month..
Daily i follow the levels like _RSEX and STS 8 3 3. with 10 mins..,
Now i am trade only intraday. Its very nice for new comers.
I am working in stockbroking in MNC. So i wish to trade in intraday as well as Positional calls for my clients. So Let me know how can i improve
my knowladge in technicals., Bcz i have waste 5 years in dealing without
technicals.,
|
|
| Back to top |
|
 |
viky_FAO
White Belt

Joined: 01 Apr 2009
Posts: 2
|
Post: #179  Posted: Mon May 18, 2009 4:33 pm Post subject: Posted: Mon May 18, 2009 4:33 pm Post subject: |
 |
|
respected rsex users,im a a student and im writing my semester exams so im not trading niftyfurures for the past 1 month,kindly any one post the intraday,30min time-frame nifty may contract chart with rsex....pls friends........
thank you.....
|
|
| Back to top |
|
 |
Stockhunter
White Belt

Joined: 10 Jun 2008
Posts: 193
|
Post: #180  Posted: Wed May 20, 2009 7:38 pm Post subject: Posted: Wed May 20, 2009 7:38 pm Post subject: |
 |
|
| viky_FAO wrote: | respected rsex users,im a a student and im writing my semester exams so im not trading niftyfurures for the past 1 month,kindly any one post the intraday,30min time-frame nifty may contract chart with rsex....pls friends........
thank you..... |
Viky - sorry please can you restate what you are asking for?
Cheers
SH
|
|
| Back to top |
|
 |
|

