| View previous topic :: View next topic |
| Author |
RSEX strategy - posted on popular demand |
Stockhunter
White Belt

Joined: 10 Jun 2008
Posts: 193
|
Post: #1  Posted: Mon Dec 29, 2008 7:32 pm Post subject: RSEX strategy - posted on popular demand Posted: Mon Dec 29, 2008 7:32 pm Post subject: RSEX strategy - posted on popular demand |
 |
|
Hi Friends,
on popular demand I am posting one of my favourite strategies to trade on one of my favourite trading stock.
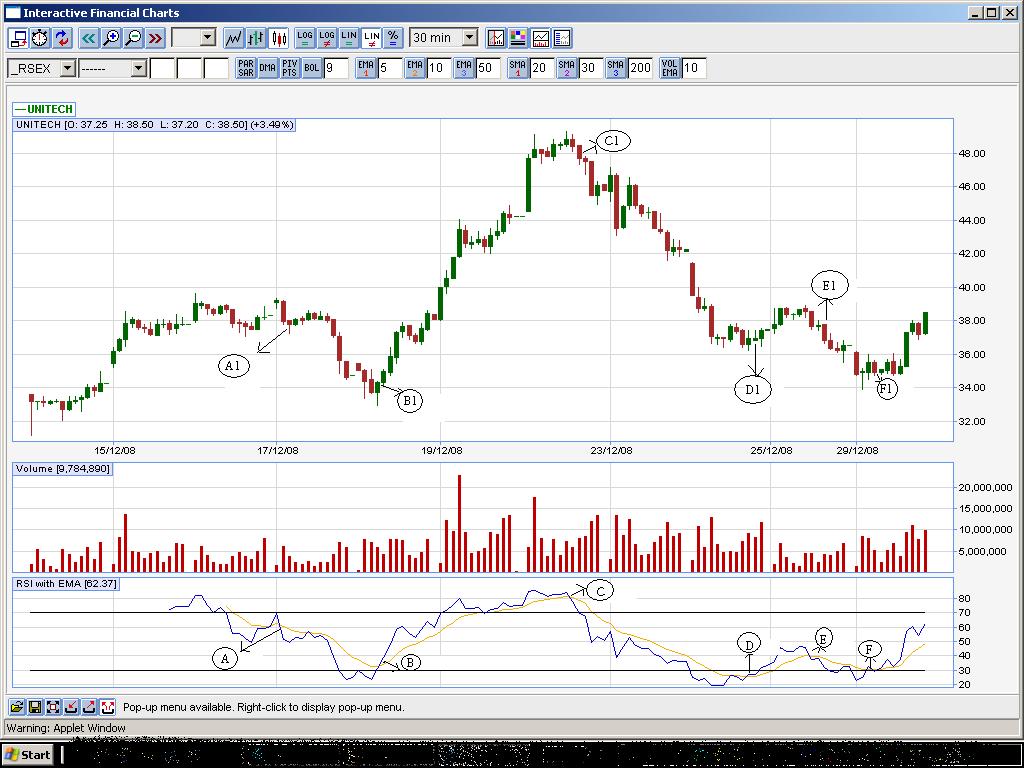
I am using Unitech 30 mins chart for last 7 days as an example for this. The entry (and exit) points are RSEX crossover.
For ease of all I have marked these points on RSEX as A,B,C,D,E and F (still open position).
Similarly on price charts the corresponding points have been marked as A1, B1, C1, D1, E1 and F1 (still open position)
If you see, bearish crossover at 38 (point A) covered at 34 (point B) means 10% returns approx.
Bullish crossover at 34 (point B) covered at 48 (point C) means 40% returns approx.
Bearish crossover at 48 (point C) covered at 38 (point D) means 20% returns approx.
Bullish crossover at 38 (point D) covered at 38 (point E) means no profit no loss.
Bearish crossover at 38 (point E) covered at 35 (point F) means 8% returns approx.
Bullish crossover at 35 (point F) still not coevered but already at 39 which is approx 10% returns again.
This is just an example and requires appropriate money management rules or hedging depending on individuals risk appetite.
But if you see by just following this simple strategy one oculd have made more than 100% returns on investment in just last 7 days.
Hope this helps your future trading.
All the best
SH
| Description: |
|
| Filesize: |
140.6 KB |
| Viewed: |
29178 Time(s) |

|
|
|
| Back to top |
|
 |
|
|
 |
sundari.s
White Belt

Joined: 25 Dec 2008
Posts: 8
|
Post: #2  Posted: Sat Jan 03, 2009 9:08 am Post subject: time frame Posted: Sat Jan 03, 2009 9:08 am Post subject: time frame |
 |
|
hi stock hunter i am sundar..........that DMI guy.....is it possible to use RSEX for intraday trading?
then which timeframe i can use?
|
|
| Back to top |
|
 |
maha
White Belt

Joined: 05 Oct 2008
Posts: 24
|
Post: #3  Posted: Sat Jan 03, 2009 10:39 pm Post subject: RSEX INDICATOR NOT FOUND Posted: Sat Jan 03, 2009 10:39 pm Post subject: RSEX INDICATOR NOT FOUND |
 |
|
| Hi, I am new to J charts, I tried to find RSEX indicator, but whenever it is applied it dont show any waveform/ crossover, it is just showing straight line, can stockhunter or anyone can please guide me. THANK U
|
|
| Back to top |
|
 |
Stockhunter
White Belt

Joined: 10 Jun 2008
Posts: 193
|
Post: #4  Posted: Wed Jan 14, 2009 5:50 pm Post subject: Posted: Wed Jan 14, 2009 5:50 pm Post subject: |
 |
|
Hi Maha... please contact ST in that case. He will be able to help you.
Thanks
|
|
| Back to top |
|
 |
vinst
Black Belt

Joined: 09 Jan 2007
Posts: 3303
|
Post: #5  Posted: Wed Jan 14, 2009 5:57 pm Post subject: Posted: Wed Jan 14, 2009 5:57 pm Post subject: |
 |
|
Hi SH,
If rsex bearish crossover, should the corresponding candle also be red? Is this a condition to be applied?
regards
vin
|
|
| Back to top |
|
 |
ashjyos
White Belt

Joined: 16 Jan 2009
Posts: 1
|
Post: #6  Posted: Fri Jan 16, 2009 9:17 pm Post subject: rsex strategies Posted: Fri Jan 16, 2009 9:17 pm Post subject: rsex strategies |
 |
|
Dear Stockhunter,
Please let me know hwre i can find this Rsex indicator. Is it associated with any stock software.Please advise.
Thanks
|
|
| Back to top |
|
 |
mbn
White Belt

Joined: 29 Nov 2007
Posts: 27
|
Post: #7  Posted: Mon Jan 26, 2009 12:11 pm Post subject: Posted: Mon Jan 26, 2009 12:11 pm Post subject: |
 |
|
Good work brother!
Keep continuing!!
Cheers,
mbn
|
|
| Back to top |
|
 |
altafghanchi
White Belt

Joined: 06 Jan 2008
Posts: 7
|
Post: #8  Posted: Wed Jan 28, 2009 12:38 am Post subject: please guide me...... Posted: Wed Jan 28, 2009 12:38 am Post subject: please guide me...... |
 |
|
| mbn wrote: | Good work brother!
Keep continuing!!
Cheers,
mbn |
sir,
what is the parameter for RSI and average crossover i am new please guide me
|
|
| Back to top |
|
 |
Stockhunter
White Belt

Joined: 10 Jun 2008
Posts: 193
|
Post: #9  Posted: Wed Jan 28, 2009 7:53 pm Post subject: Posted: Wed Jan 28, 2009 7:53 pm Post subject: |
 |
|
Vinst - no there is not any such condition. The only condition I apply is to trade in the direction of the EMA whenever possible unless there is clear crossover......
Ashjyos - Rsex is avaliable on Icharts.
MBN - thanks.
Altafgghanchi - Please use default parameters.
Cheers
|
|
| Back to top |
|
 |
vinst
Black Belt

Joined: 09 Jan 2007
Posts: 3303
|
Post: #10  Posted: Thu Jan 29, 2009 12:50 pm Post subject: Posted: Thu Jan 29, 2009 12:50 pm Post subject: |
 |
|
SH,
thanks for replying. However the sample chart u posted does not seem to be avlbl now? which ema u use on price to trade in its direction after hint from rsex?
regards,
vin
|
|
| Back to top |
|
 |
Stockhunter
White Belt

Joined: 10 Jun 2008
Posts: 193
|
Post: #11  Posted: Tue Feb 10, 2009 4:43 pm Post subject: Posted: Tue Feb 10, 2009 4:43 pm Post subject: |
 |
|
| Hi vinst ... I use 20 EMA and RSEX.
|
|
| Back to top |
|
 |
Stockhunter
White Belt

Joined: 10 Jun 2008
Posts: 193
|
Post: #12  Posted: Tue Feb 10, 2009 5:25 pm Post subject: RSEX - another illustration Posted: Tue Feb 10, 2009 5:25 pm Post subject: RSEX - another illustration |
 |
|
H guys,
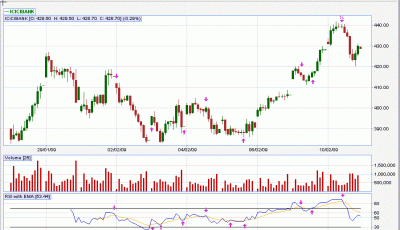
I am posting one more illustration on how just RSEX can be used to mint money in our mkts. I have used ICICI 30 mins charts this time to show the power of RSEX.
Please follow the pink up arrows (indicating buys) and down arrows (indicating sells) and work out the P&L for the last 10 days.
Cheers
SH
| Description: |
|
| Filesize: |
18.99 KB |
| Viewed: |
1880 Time(s) |

|
|
|
| Back to top |
|
 |
Stockhunter
White Belt

Joined: 10 Jun 2008
Posts: 193
|
Post: #13  Posted: Tue Feb 10, 2009 5:42 pm Post subject: NIfty Posted: Tue Feb 10, 2009 5:42 pm Post subject: NIfty |
 |
|
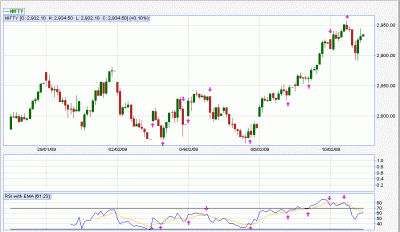
Similar application on Nifty 30 mins charts if you just love Nifty !!
| Description: |
|
| Filesize: |
16.59 KB |
| Viewed: |
1538 Time(s) |

|
|
|
| Back to top |
|
 |
jonhnabrahm
White Belt

Joined: 10 Feb 2009
Posts: 1
|
Post: #14  Posted: Tue Feb 10, 2009 5:48 pm Post subject: Posted: Tue Feb 10, 2009 5:48 pm Post subject: |
 |
|
| Thank you for the post...it seems to be very useful....
|
|
| Back to top |
|
 |
TradeHunter
White Belt

Joined: 29 Jan 2009
Posts: 17
|
Post: #15  Posted: Tue Feb 10, 2009 5:59 pm Post subject: TF Posted: Tue Feb 10, 2009 5:59 pm Post subject: TF |
 |
|
Respected SH ji,can u pls tell me the best TF for intraday trading.....
thank u...
|
|
| Back to top |
|
 |
|

