| View previous topic :: View next topic |
| Author |
RSI 2 - TREND TRADING SET UP. |
sherbaaz
Yellow Belt

Joined: 27 May 2009
Posts: 543
|
Post: #1  Posted: Thu Aug 12, 2010 4:25 pm Post subject: RSI 2 - TREND TRADING SET UP. Posted: Thu Aug 12, 2010 4:25 pm Post subject: RSI 2 - TREND TRADING SET UP. |
 |
|
Extreme pull back method in an uptrend and rally sell off in down trend.
Tools:
1) RSI @2 (instead of 14), oversold @10 (instead of 30) and overbought @90 (instead of 70).
2)DMI 14.
3)20 SMA, 50 SMA & 200 SMA (200 SMA is optional).
4) FIBONACCI retracement for profit booking.
Time frame- I am using 60 min TF and EOD (try on your favorite TF).
One can use different combination of moving averages as per their comfort; important thing is the understanding of concept.
RULES FOR LONG TRADE:
1) 20SMA >50SMA>200SMA (200 SMA is optional).
2) An uptrend is visible. The slop of moving averages’ll be up.
3) +DMI>-DMI (essential condition).
4) Long when 2 period(s) RSI is below 10.
5) Stop loss is subjective I normally put some points below the candle I enter long trade.
6) For profit booking I am using Fibonacci.
RULE FOR SHORT TRADE:
1) 20SMA<50<SMA<200<SMA>+DMI (essential condition).
4) Short when 2 period(s) RSI is above 90.
SL & profit booking as per points (5) & (6).
The set up does not work in range bound markets so don’t try to use it.
This is not my set up (read it somewhere and put some additional things to it). I have been using is for quite some time and having decent profit. Do remember that “PROFITS ARE NOT EXPLOSIVE” but “CONSISTENT”. One will always trade in the direction of the wind (trend).
IT IS NOT THE HOLY GRAIL. AT THE TIME OF BACKTESTING ON CHARTS IT LOOKS LIKE EVERYTHING IS FALLING IN PLACE. BUT IN REAL TIME TRADE THINGS ARE VERY DIFFERENT. DO SOME PAPER TRADING FIRST WITH THE SET UP (IF LIKE IT AND WANT TO USE IT).
I am not an expert of the set up so kindly give feedback & suggestions for improving it further.
Regards.
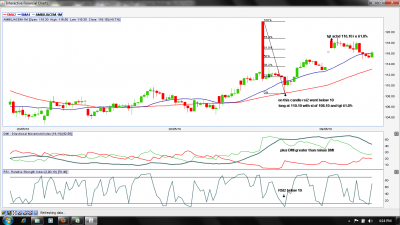
PS: I am attaching a chart of AMBUJACEM-1M chart for reference:
| Description: |
|
| Filesize: |
134.13 KB |
| Viewed: |
1004 Time(s) |

|
|
|
| Back to top |
|
 |
|
|  |
loke12k
White Belt

Joined: 31 Mar 2008
Posts: 10
|
Post: #2  Posted: Thu Aug 12, 2010 6:46 pm Post subject: Posted: Thu Aug 12, 2010 6:46 pm Post subject: |
 |
|
thanks. very nicely explained. had read about this technique long time back...
thanks again.
|
|
| Back to top |
|
 |
sherbaaz
Yellow Belt

Joined: 27 May 2009
Posts: 543
|
Post: #3  Posted: Thu Aug 12, 2010 9:49 pm Post subject: Posted: Thu Aug 12, 2010 9:49 pm Post subject: |
 |
|
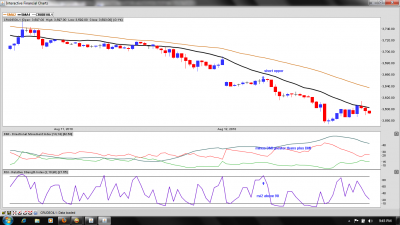
Attaching CRUDEOIL-1M chart
TF-20 MIN
see the strongly bearish trend as wide gap between 20 and 50 sma.
Although not traded it but very clean set up for short .
regards,
| Description: |
|
| Filesize: |
123.38 KB |
| Viewed: |
700 Time(s) |

|
|
|
| Back to top |
|
 |
smartcancerian
Yellow Belt

Joined: 07 Apr 2010
Posts: 542
|
Post: #4  Posted: Fri Aug 13, 2010 8:33 am Post subject: Posted: Fri Aug 13, 2010 8:33 am Post subject: |
 |
|
Thanx Sherbaaz bhai.. 
|
|
| Back to top |
|
 |
smartcancerian
Yellow Belt

Joined: 07 Apr 2010
Posts: 542
|
Post: #5  Posted: Fri Aug 13, 2010 8:34 am Post subject: Posted: Fri Aug 13, 2010 8:34 am Post subject: |
 |
|
Thanx Sherbaaz bhai.. 
|
|
| Back to top |
|
 |
sherbaaz
Yellow Belt

Joined: 27 May 2009
Posts: 543
|
Post: #6  Posted: Fri Aug 13, 2010 3:52 pm Post subject: Posted: Fri Aug 13, 2010 3:52 pm Post subject: |
 |
|
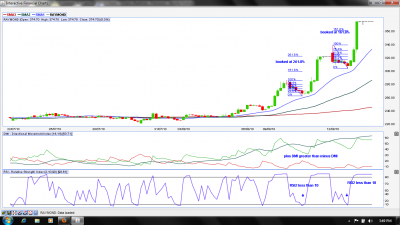
Attaching RAYMOND 60 MIN TF.
2 good long opportunities in last 10 days.
regards,
| Description: |
|
| Filesize: |
127.48 KB |
| Viewed: |
775 Time(s) |

|
|
|
| Back to top |
|
 |
|
|
You cannot post new topics in this forum
You cannot reply to topics in this forum
You cannot edit your posts in this forum
You cannot delete your posts in this forum
You cannot vote in polls in this forum
You can attach files in this forum
You can download files in this forum
|
Powered by phpBB © 2001, 2005 phpBB Group
|
|

