| View previous topic :: View next topic |
| Author |
RSI Divergences & its impact |
ConMan
White Belt

Joined: 06 Aug 2008
Posts: 344
|
Post: #1  Posted: Sat Jan 30, 2010 9:02 am Post subject: RSI Divergences & its impact Posted: Sat Jan 30, 2010 9:02 am Post subject: RSI Divergences & its impact |
 |
|
Dear All
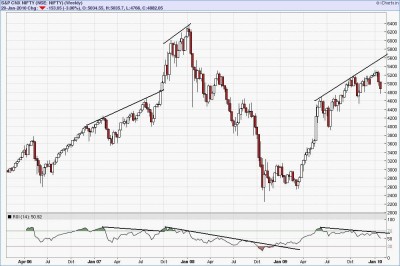
I have attached herewith Nifty spot weekly chart for the last 4 years. I have highlighted the places where RSI divergences have occured. Though the price has not reacted to it immediately....we see it correcting all the divergences over a period of time.
We are living in divergence era & 4500 is any day possible.
Rgds
QGM
| Description: |
|
| Filesize: |
96.99 KB |
| Viewed: |
974 Time(s) |
|
|
|
| Back to top |
|
 |
|
|
|
mariselvam
White Belt
Joined: 14 Oct 2008
Posts: 5
|
| Post: #2 Posted: Fri Mar 05, 2010 10:26 pm Post subject: |
|
|
Thank you for the great information murugan anna.
the govt buyback stimulative package announcements after the budget pull the market into your predict zone.
thank you once again.
srimariselvam.g.
|
|
| Back to top |
|
|
sreenath77
White Belt
Joined: 28 Nov 2009
Posts: 18
|
| Post: #3 Posted: Sat Mar 06, 2010 10:48 am Post subject: |
|
|
Hi,
Inspite of divergence Nifty rose from 5000 to 6000. So, divergence really doesnot matter. Why not we read it this way?
I am saying this as I wanted to check if divergence can be trusted to make a trading decision. Even if the divergence is present, Nifty can move a 1000 points against it. No point considering this.
Regards,
Sreenath
|
|
| Back to top |
|
|
peace69
White Belt
Joined: 27 Aug 2009
Posts: 113
|
| Post: #4 Posted: Wed Apr 07, 2010 2:15 pm Post subject: |
|
|
hi sreenath77,
Actually divergence gives alert about coming reversal. no rule of thumb that it give instant result. it just tells to beware. although i'm using it successfully in intraday trading on nifty, sometimes it may give fake signal. & that's where SL comes in. in trending mkt, it gives false divergence signal. so one should check if mkt is in trend. now take ex. of nifty up to date. it's giving neg div on more then one indicators, still nifty is rising. before JAN - 08 crash, divergence was started from oct - 07. it's all about probability. no mater how many times u succeed, it's still remains 50-50 % chances. these indicators are made by us & can violate by some of us. that's all.
regards
96yxalag
|
|
| Back to top |
|
|
sherbaaz
Yellow Belt

Joined: 27 May 2009
Posts: 543
|
| Post: #5 Posted: Wed Apr 07, 2010 4:23 pm Post subject: |
|
|
Hi All,
I hope this is the right thread to share my views on RSI divergence, which i use frequently in my trading decisions as one of the leading indicators.
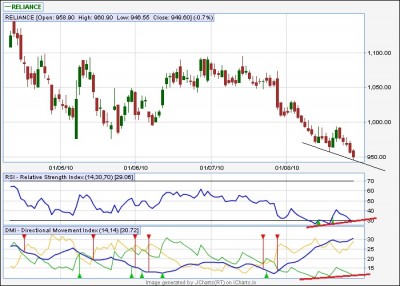
I am attaching nifty future charts (eod) which shows class A bearish divergence. Another importent point is it has formed along with the formation of DOJI and that to at weekly R2. Which was not taken over by today's candle.
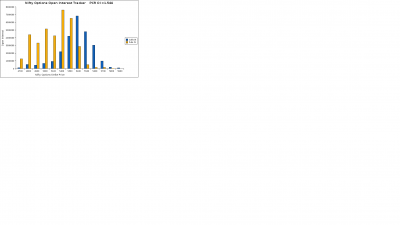
I am also attaching put call OI chart, which shows there is a resistance at 5400 and support at 5200.
If i combine above things togather I would be having bearish bias for coming days if nf not able to close above today's high.
I would still wait for confirmation to go short on nifty.
regds
PS: The above are my views, which are only for discussion purpose. Kindly use your own analysis for trading.
| Description: |
|
| Filesize: |
58.47 KB |
| Viewed: |
647 Time(s) |
|
| Description: |
|
| Filesize: |
34.01 KB |
| Viewed: |
690 Time(s) |
|
|
|
| Back to top |
|
|
peace69
White Belt
Joined: 27 Aug 2009
Posts: 113
|
| Post: #6 Posted: Wed Apr 07, 2010 10:19 pm Post subject: Nifty Intra Pos Class A Div. |
|
|
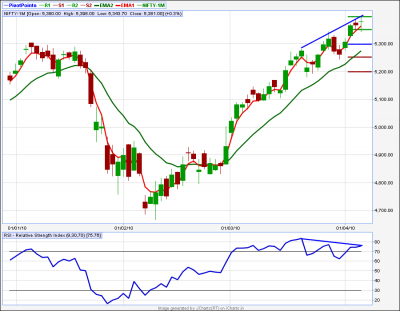
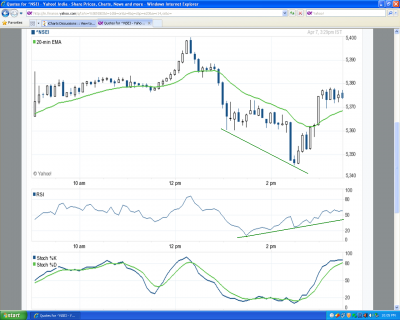
there's pos. div. in nifty after sharp decline. 5345 may be now latest sl for long. it's revision of fake sell off on 31/03/2010 (bear trap) when returned from 5235 after breaching of 5250-40 sup at that time. here is chart of RSI div. notice slow stoch in os zone. absolute low risk great risk:reward trade.
regards.
| Description: |
|
| Filesize: |
198.84 KB |
| Viewed: |
661 Time(s) |
|
|
|
| Back to top |
|
|
peace69
White Belt
Joined: 27 Aug 2009
Posts: 113
|
| Post: #7 Posted: Wed Apr 07, 2010 10:46 pm Post subject: Neg. Div. TATA STEEL EOD |
|
|
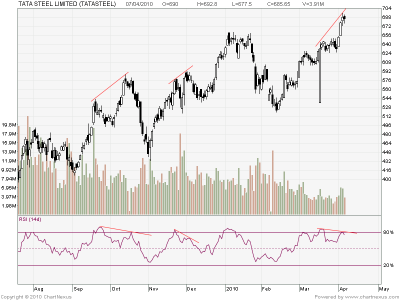
Hi all,
will like u to take a look at attached chart of Tata Steel showing Neg. Div. & give your view.
regards
| Description: |
| Tata Steel Neg Classs 'A' Div. |
|
| Filesize: |
28.52 KB |
| Viewed: |
680 Time(s) |
|
|
|
| Back to top |
|
|
sherbaaz
Yellow Belt
Joined: 27 May 2009
Posts: 543
|
| Post: #8 Posted: Thu Apr 08, 2010 4:15 pm Post subject: |
|
|
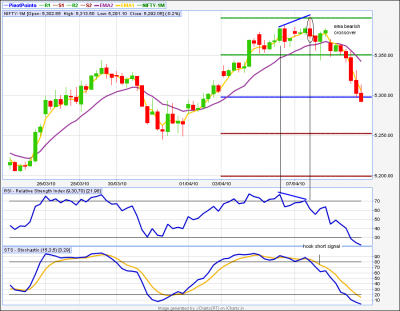
Hi All,
As expecting yday there was a sharp decline in nifty future today. I am attaching my intraday trade chart of nifty future.
TF-60 minute
Weekly pivot points
Class A bearish divergence was formed yday only on 60 mint tf (also on eod chart). Now the imp thing for me was that this divergence was formed with shooting star (circle one) and that too at weekly R2, which was just touched by shooting star.
Short signal was given by STS yday only but i waited for confirmation of ema cross over which happened today where I shorted nifty with 5300 as tgt (it’s also a weekly pivot line). Also the fall was with increasing volume
Again I would emphasis that it’s the whole system for me which works and RSI divergence is an important indicator in my system. On stand alone basis it may not be that powerful.
regds
| Description: |
|
| Filesize: |
64.37 KB |
| Viewed: |
818 Time(s) |
|
|
|
| Back to top |
|
|
peace69
White Belt
Joined: 27 Aug 2009
Posts: 113
|
| Post: #9 Posted: Thu Apr 08, 2010 4:49 pm Post subject: |
|
|
Hi sherbaaz, good work. I always prefer to count on 60 min as it gives more reliable signal. I notice RSI parameters on chart posted by u recently. it's 9,30,17. i used to take position as par chart provided by finance.yahoo.co.in. will like to know which setting they r using. like to know your view about which setting on RSI works better on 60 min TF? yesterday nifty gave pos. class A div. chart posted recently. although it's down today, still it's successfull on intra day 5 min TF as Div was on shorter TF, it's valid for short time - intra day - only.
regards.
|
|
| Back to top |
|
|
sherbaaz
Yellow Belt
Joined: 27 May 2009
Posts: 543
|
| Post: #10 Posted: Thu Apr 08, 2010 8:01 pm Post subject: |
|
|
Hi 96,
What ever TF i am using i use rsi @9,30,70. I normally trade either on eod charts or 60 min tf (intraday trading). the chart posted by you yday of yahoo hold valid for yday only as it was an intraday chart and u cant analysis anything for next day from the chart.
yahoo is using default setting of 14 in rsi.
regds
|
|
| Back to top |
|
|
girishhu1
White Belt
Joined: 17 Aug 2009
Posts: 316
|
| Post: #11 Posted: Sat Apr 10, 2010 6:42 am Post subject: |
|
|
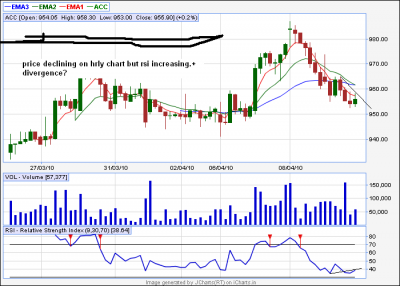
do u c enough + divergence on acc chart enclosed?
| Description: |
|
| Filesize: |
33.96 KB |
| Viewed: |
702 Time(s) |
|
|
|
| Back to top |
|
|
solanki
White Belt
Joined: 12 Feb 2007
Posts: 155
|
| Post: #12 Posted: Sat Apr 10, 2010 10:42 am Post subject: |
|
|
sir ji
which ema use in your intra day charts
|
|
| Back to top |
|
|
ConMan
White Belt
Joined: 06 Aug 2008
Posts: 344
|
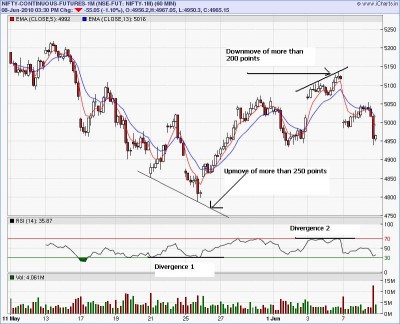
| Post: #13 Posted: Tue Jun 08, 2010 3:55 pm Post subject: Recent One |
|
|
One more
| Description: |
|
| Filesize: |
93.08 KB |
| Viewed: |
694 Time(s) |
|
|
|
| Back to top |
|
|
ConMan
White Belt
Joined: 06 Aug 2008
Posts: 344
|
|
| Back to top |
|
|
sambhaji_t
White Belt
Joined: 31 Mar 2008
Posts: 135
|
| Post: #15 Posted: Sun Aug 29, 2010 10:05 am Post subject: |
|
|
| sherbaaz wrote: | Hi All,
I hope this is the right thread to share my views on RSI divergence, which i use frequently in my trading decisions as one of the leading indicators.
I am attaching nifty future charts (eod) which shows class A bearish divergence. Another importent point is it has formed along with the formation of DOJI and that to at weekly R2. Which was not taken over by today's candle.
I am also attaching put call OI chart, which shows there is a resistance at 5400 and support at 5200.
If i combine above things togather I would be having bearish bias for coming days if nf not able to close above today's high.
I would still wait for confirmation to go short on nifty.
regds
PS: The above are my views, which are only for discussion purpose. Kindly use your own analysis for trading. |
Sherbaaz how do u get this chart of P/C ratio, is it available for stocks
|
|
| Back to top |
|
|
|