|
|
| View previous topic :: View next topic |
| Author |
RUNNING WITH THE WOLVES |
sumesh_sol
Brown Belt

Joined: 06 Jun 2010
Posts: 2344
|
Post: #451  Posted: Fri Sep 16, 2011 12:26 pm Post subject: Posted: Fri Sep 16, 2011 12:26 pm Post subject: |
 |
|
| rk_a2003 wrote: | | WW in Bhartiartl EOD chart. |
Hi rk,
Well I'm not judging this setup as correct or not, but I have an observation. The more clear and distinct points, the more are the chances of success. In this setup please see point1, now this could be anypoint nearby the one mentioned here, but to suit the down trendline this one has been selected..
So, to be more sure if we treat point3 of this setup as point1 and then allow it to form point4 & 5, then may be some clear pcture can emerge..
It may take time, may be weeks, but in my humble opinion better to have clear points..
Rest market is supreme...
Regards,
Sumesh
|
|
| Back to top |
|
 |
|
| |
rk_a2003
Black Belt

Joined: 21 Jan 2010
Posts: 2734
|
| Post: #452 Posted: Fri Sep 16, 2011 1:03 pm Post subject: |
|
|
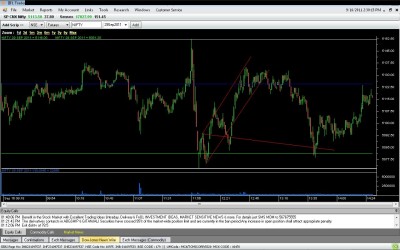
A bearish ww formed on 1 m nifty chart with a target of 5080 ( approx)
S/L can be 5140 ( First check for your self ).
I am not able to post the chart due to some tech. problem.
|
|
| Back to top |
|
|
rk_a2003
Black Belt
Joined: 21 Jan 2010
Posts: 2734
|
| Post: #453 Posted: Fri Sep 16, 2011 1:28 pm Post subject: |
|
|
Sumesh!
We can do that  . .
While selecting point 1 I thought a little. finally stick to it due to reason it was the starting point for uptrend line 1 2 .
I don't see any chart's with preconceived notions. while observing charts. I notice ww formations , that's all.
Any how, thanks for your inputs.
RK
| sumesh_sol wrote: | | rk_a2003 wrote: | | WW in Bhartiartl EOD chart. |
Hi rk,
Well I'm not judging this setup as correct or not, but I have an observation. The more clear and distinct points, the more are the chances of success. In this setup please see point1, now this could be anypoint nearby the one mentioned here, but to suit the down trendline this one has been selected..
So, to be more sure if we treat point3 of this setup as point1 and then allow it to form point4 & 5, then may be some clear pcture can emerge..
It may take time, may be weeks, but in my humble opinion better to have clear points..
Rest market is supreme...
Regards,
Sumesh |
|
|
| Back to top |
|
|
rk_a2003
Black Belt
Joined: 21 Jan 2010
Posts: 2734
|
| Post: #454 Posted: Fri Sep 16, 2011 1:37 pm Post subject: |
|
|
| rk_a2003 wrote: | A bearish ww formed on 1 m nifty chart with a target of 5080 ( approx)
S/L can be 5140 ( First check for your self ).
I am not able to post the chart due to some tech. problem. |
Nifty at 5100 Book 50 % profits and remaining tsl to cost to cost.
|
|
| Back to top |
|
|
rk_a2003
Black Belt
Joined: 21 Jan 2010
Posts: 2734
|
| Post: #455 Posted: Fri Sep 16, 2011 1:41 pm Post subject: |
|
|
Target reached . Book full profits. 
| rk_a2003 wrote: | | rk_a2003 wrote: | A bearish ww formed on 1 m nifty chart with a target of 5080 ( approx)
S/L can be 5140 ( First check for your self ).
I am not able to post the chart due to some tech. problem. |
Nifty at 5100 Book 50 % profits and remaining tsl to cost to cost. |
|
|
| Back to top |
|
|
rk_a2003
Black Belt
Joined: 21 Jan 2010
Posts: 2734
|
| Post: #456 Posted: Fri Sep 16, 2011 1:50 pm Post subject: |
|
|
Shorted at 5129. partially booked at 5100. Finally covered at 5080.
Any one else ?let me know please.
RK
| rk_a2003 wrote: | Target reached . Book full profits.
| rk_a2003 wrote: | | rk_a2003 wrote: | A bearish ww formed on 1 m nifty chart with a target of 5080 ( approx)
S/L can be 5140 ( First check for your self ).
I am not able to post the chart due to some tech. problem. |
Nifty at 5100 Book 50 % profits and remaining tsl to cost to cost. |
|
|
|
| Back to top |
|
|
rk_a2003
Black Belt
Joined: 21 Jan 2010
Posts: 2734
|
| Post: #457 Posted: Fri Sep 16, 2011 2:59 pm Post subject: Re: bharti |
|
|
Expected time is November 1st 2nd weeks. Target is above 450 as per chart.
| Vinodz wrote: | thanks for bharti chart,
what is tgt expected and in wht time period |
|
|
| Back to top |
|
|
jjm
White Belt

Joined: 17 Mar 2010
Posts: 411
|
| Post: #458 Posted: Fri Sep 16, 2011 4:07 pm Post subject: |
|
|
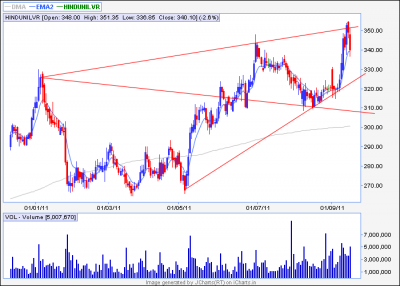
HUL Eod,
Regards,
JJM
| Description: |
|
| Filesize: |
23.94 KB |
| Viewed: |
355 Time(s) |
|
|
|
| Back to top |
|
|
ramamoorthi
White Belt
Joined: 08 May 2011
Posts: 101
|
| Post: #459 Posted: Fri Sep 16, 2011 6:51 pm Post subject: |
|
|
EXPERT PLZ COMMENT ABOUT,,,,,,,,,,CHAMBAL FERT CURRENT RATE RS 106
KINDLY COMMENT THIS MONTH EXPIRY TARGET,,,
RAMAMOORTHI
|
|
| Back to top |
|
|
chandrujimrc
Brown Belt
Joined: 21 Apr 2009
Posts: 1683
|
| Post: #460 Posted: Fri Sep 16, 2011 7:50 pm Post subject: Running with the wolves |
|
|
Dear sumesh/jjm,
SBIN Eod + WW,your comments pl.
chandru.
| Description: |
|
| Filesize: |
27.1 KB |
| Viewed: |
313 Time(s) |

|
|
|
| Back to top |
|
|
rk_a2003
Black Belt
Joined: 21 Jan 2010
Posts: 2734
|
| Post: #461 Posted: Sat Sep 17, 2011 1:20 pm Post subject: |
|
|
Hi All!
I would like to discuss some more points on wolf wave? As per the standard literature - Wolfe Wave is a natural rhythm that exists in all markets. It is made up of waves of supply and demand that form their own equilibrium. These patterns can develop over short- and long-term time frames such as minutes or weeks and are used to predict where a price is heading and when it will get there. The Wolfe Wave is named after Bill Wolfe and Brian Wolfe who say that they "discovered it, and did not invent it."
The key to its accuracy is in properly identifying the 1, 2, 3, 4 & 5 points. These are what give it its proper balance of equilibrium. It is very important to identify the dominant Wave. It is somewhat like recognizing those 3-D pictures.
It needs some practice and observation, after few days (may vary from person to person) we will be able to recognize these patterns while happening itself. After the formation of point 5 only we will be able to say that it was formed. That’s why it is really difficult to identify and trade on intraday basis. As we have to identify it at the moment it happens, for trading it.
It is an ideal situation if all the points form as explained in the book. But, in real life often it may not happen like that. The fear and greed may vacillate wildly sometimes; especially when volatility is high and if you are looking for a trade on intraday basis they may overshoot/ undershoot at certain points.
What I understood from this pattern is bears and bulls fighting for dominance. We know that each wolf wave comprises of 5 waves showing supply and demand and a fight for equilibrium. In Bearish/Bullish WW Initially it appears that Bulls/Bears are winning (and they appears to be winning till point 5).But after 3 futile attempts Bulls/Bears give up and the opponent takeover and wins for time being in a substantial way( and ww traders cash on it). When the probe of the 4 point exceeds the equilibrium between supply and demand, and declines towards the 5 point, it bounces back towards EPA with more power. It was described in standard literature that the winning percentage of this pattern is more than 90% (amazing! isn’t it?).
You can catch a trade in intraday even on one / two minute TF, but it may not be a Wave similar to the examples shown everywhere. The reason is that if these Waves are on a larger time frame they will be in clear recognizable pattern, you will only see an unrecognizable part of it on a one minute / two minute time frame.
On Friday I did ( 16/09/2011) a WW trade on intraday Nifty for which I posted Live calls on this thread. Look at this chart, some of you may not accept this as ww pattern. But, I believe and also experienced that it is hard to find picture perfect ww on 1 minute chart (especially when volatility is so high) .On this trade I got 49 points, Shorted at 5129 (stop loss 5140) booked partially at 5000 and rest at 5080.
I read some literature and also visited some websites regarding ww some time back. I took it seriously very recently after completely going through the ‘Running with the wolves’ thread. A special Thanks to Sumesh, who ignited some interest within me for ww, with his continuous postings on ww and to Casper who corrected me through his private messages.
Thanks to all, who started this thread and contributed to this.
Such threads inspire each other and educate all of us. These threads replace collective experience with individual one, which is far more superior. Thats the exact reason why I am posting my experiences and observations here.
I took a ww trade in rcom some time back; I observed a perfect bearish ww formation on an intraday tick by tick chart and admired it so much that I could not stop myself from trading it. It gave me the EPA (Expected Price Arrival). This is the first trade in my life which I executed without any tension, from the next movement I entered the trade I was never even in a notional loss. It was amazing to observe later that rcom is in uptrend, and after handing over me profit for my short it continued its upward journey silently. This was the moment I realized the true potential of ww and I felt in love with Wolf Wave. Till this time, I took up few more trades and yet to taste a failure.
I invite the discussions from all the boarders who are interested in WW .
Thanks & Regards
RK
| Description: |
|
| Filesize: |
148.3 KB |
| Viewed: |
352 Time(s) |
|
Last edited by rk_a2003 on Sun Sep 18, 2011 10:22 am; edited 1 time in total |
|
| Back to top |
|
|
Vinodz
White Belt
Joined: 13 Aug 2011
Posts: 78
|
| Post: #462 Posted: Sat Sep 17, 2011 3:54 pm Post subject: HUL target and in what time period |
|
|
jjm sir,
thank you for posting HUL chart
In a WW,
Pls explain How does one determine the time period
in which target price will be achieved
Like in this case of HUL target and in what time period
Thank you sir
|
|
| Back to top |
|
|
rk_a2003
Black Belt
Joined: 21 Jan 2010
Posts: 2734
|
| Post: #463 Posted: Sat Sep 17, 2011 4:30 pm Post subject: Re: HUL target and in what time period |
|
|
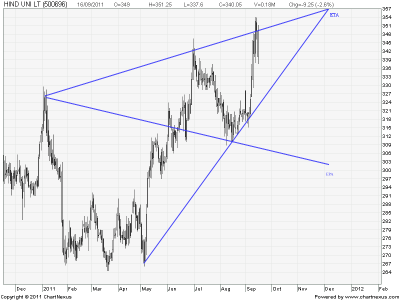
Vinod !
Expected Price Arrival (EPA) is 302 and Expected Time arrival (ETA )is December 1st week.
Observe the attached chart , you will know how to determine EPA and ETA.
| Vinodz wrote: | jjm sir,
thank you for posting HUL chart
In a WW,
Pls explain How does one determine the time period
in which target price will be achieved
Like in this case of HUL target and in what time period
Thank you sir |
| Description: |
|
| Filesize: |
35.3 KB |
| Viewed: |
321 Time(s) |
|
|
|
| Back to top |
|
|
rk_a2003
Black Belt
Joined: 21 Jan 2010
Posts: 2734
|
| Post: #464 Posted: Sun Sep 18, 2011 10:46 am Post subject: |
|
|
Hi All !
No single response to my posting on ww . 
At least, some one can say Nifty was moving in a channel . You shorted it at upper band and covered it at lower band.( It has nothing to do with ww as you are in love with it , everything looks like ww for you) 
Come on guys! say some thing please.
Silence is really dreadful.
RK
|
|
| Back to top |
|
|
peace69
White Belt
Joined: 27 Aug 2009
Posts: 113
|
| Post: #465 Posted: Sun Sep 18, 2011 11:55 am Post subject: |
|
|
| rk, chill down, dear. may be it's due to week end. as it's said, patterns r in the eyes. pattern must be jump out of charts. the more effort need to detect pattern, more chances to failure. in shorter tf, it may be not viable as l'le time to form & finish. it's nice to know u find ww producive. but mind it, every pattern has it's own cons & pros. every pattern destines to fail now or then. no pattern is fullproof. about succss ratio, it too changes with time. although i have no way to check it on longer tf on diff tf, i'm sure it's viable to ww too. so keep trading on it with strict money management & never ever put all eggs in one nest. i too trade it & found successive with lesser whipsaw so far. hope don't mind about unwarrented advise. write what i feel & experienced in past. rest on yours. wish happy & prosprous trading. keep sharing. regards.
|
|
| Back to top |
|
|
|
|
You cannot post new topics in this forum
You cannot reply to topics in this forum
You cannot edit your posts in this forum
You cannot delete your posts in this forum
You cannot vote in polls in this forum
You can attach files in this forum
You can download files in this forum
|
Powered by phpBB © 2001, 2005 phpBB Group
|
|
|


