| View previous topic :: View next topic |
| Author |
RUNNING WITH THE WOLVES |
maneesh007
White Belt

Joined: 08 Feb 2009
Posts: 119
|
Post: #601  Posted: Sat Sep 24, 2011 11:03 pm Post subject: Posted: Sat Sep 24, 2011 11:03 pm Post subject: |
 |
|
| rk_a2003 wrote: | It is always advisable to mention the time frame while posting the chart.
I could not see the chart properly due to your w lines.
However, It appears to be ok.
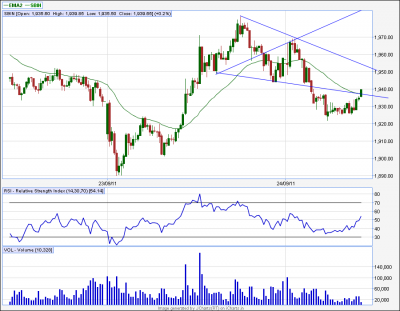
| maneesh007 wrote: | | What abt this one... |
|
ok bhai, i will keep it in mind & thanks once again for confirming...
regards
maneesh bhardwaj
|
|
| Back to top |
|
 |
|
|
|
sumesh_sol
Brown Belt

Joined: 06 Jun 2010
Posts: 2344
|
| Post: #602 Posted: Sat Sep 24, 2011 11:31 pm Post subject: Re: CIPLA..eod |
|
|
| Arjun20 wrote: | | sumesh_sol wrote: | CIPLA..eod
=========
Although Before entering into channel, I prefer a fullbody close outside lower channel .. But, as it is showing constant divergence at bottom, I would go for it with a SL of CLOSE below 270 on DAILY basis..
Excellent R:R (1:7) ! |
Sumesh bhai,
if we see the same WW channel in weekly TF, then there's a HnS in formation and the WW lower TL is neckline on Hns pattern.
Break-out of HnS is yet to happen. So one needs to be careful about moves outside channel.
Am i right Sumesh? |
Arjun,
You see, there are many chart formations which keep on happening at different timeframes during price movement.. That is the reason you will find that a stock is in Downtrend in one timeframe and in Uptrend in another! Ultimately they all play out..
Now, here as you said H&S on weekly may take effect, but before that WW on daily CAN complete its target which could be small if u see on weekly...
and SL is always there to protect us against unfavorable moves... So Once we are confirmed abt pattern, simply dive in with suitable protection, and let market decide..
|
|
| Back to top |
|
|
rk_a2003
Black Belt

Joined: 21 Jan 2010
Posts: 2734
|
| Post: #603 Posted: Sun Sep 25, 2011 7:23 am Post subject: |
|
|
Vinay! sorry!
I missed your point.You must be talking about shorter time frame calls.I wll try to post buy/sell, target, S/L.
Infact my earlier short term ww postings includes them. 
RK
| rk_a2003 wrote: | Vinay!
In case a valid +ww or -ww chart is posted ,no need to give buy/sell price , Stop loss or target.Every thing is embedded in chart.
How ever, I will explain it again .A standard way to enter in to sell / buy is After over shooting at point 5 price will start declining / climbing , during this course once it crosses the trend line one can take a position. That is sell/buy price. Stoploss should be just above /below the overshoot.
Target is already given by Line 1 4 .If you can enter two lots, one lot can be booked at half way or at any reasonable Resistance/ Support level.The second lot can be booked at target.
I hope I was clear.
| vinay28 wrote: | | RK, would appreciate if you also give buy/sell with prices and target/SL when you post so that a lot of people will benefit |
|
|
|
| Back to top |
|
|
rk_a2003
Black Belt
Joined: 21 Jan 2010
Posts: 2734
|
| Post: #604 Posted: Sun Sep 25, 2011 8:18 am Post subject: |
|
|
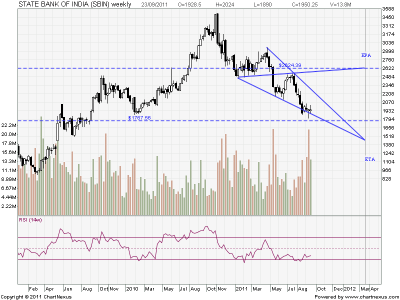
SBIN Weekly chart with +WW. ETA ( Expected Time Arrival) is 3rd week of March 2012 and EPA is 2624/-.
The Chart speaks everything.
I took this cue from Shekhar's posting in another thread .He is the founder of this wonderful thread and named it very aptly "Running With the Wolves"
| Description: |
|
| Filesize: |
31.72 KB |
| Viewed: |
308 Time(s) |
|
|
|
| Back to top |
|
|
Ravi_S
Yellow Belt

Joined: 15 Jun 2009
Posts: 569
|
| Post: #605 Posted: Sun Sep 25, 2011 8:24 am Post subject: |
|
|
rk... I posted this chart in this thread on 19th Link below
http://www.icharts.in/forum/running-with-the-wolves-t2310,postorder,desc,start,120.html
| rk_a2003 wrote: | SBIN Weekly chart with +WW. ETA ( Expected Time Arrival) is 3rd week of March 2012 and EPA is 2624/-.
The Chart speaks everything.
I took this cue from Shekhar's posting in another thread .He is the founder of this wonderful thread and named it very aptly "Running With the Wolves" |
|
|
| Back to top |
|
|
rk_a2003
Black Belt
Joined: 21 Jan 2010
Posts: 2734
|
| Post: #606 Posted: Sun Sep 25, 2011 8:37 am Post subject: |
|
|
| sorry Ravi! for missing your post.
|
|
| Back to top |
|
|
ronypan
White Belt
Joined: 07 Aug 2010
Posts: 197
|
| Post: #607 Posted: Sun Sep 25, 2011 11:38 am Post subject: |
|
|
Just casually asking, Its good if you are gaining on this..
If possible, Post Entry Point, SL, Tgt with Chart, It will be beneficial to all.
| rk_a2003 wrote: | Rony!
Is this question directed to me?.What's the point in it?!
I trade most of the Shorter time frame trades posted by me.I also trade some patterns posted by others too, if I was convinced with them.
Few times ,I post some patterns just out of academic interest, and I mention my intention clearly.
Why are you asking this?!
| ronypan wrote: | | vinay28 wrote: | | RK, would appreciate if you also give buy/sell with prices and target/SL when you post so that a lot of people will benefit |
x2..
and One more thing, Do you trade whatever the patterns you post here? |
|
|
|
| Back to top |
|
|
rk_a2003
Black Belt
Joined: 21 Jan 2010
Posts: 2734
|
| Post: #608 Posted: Sun Sep 25, 2011 12:33 pm Post subject: |
|
|
Hi All!
As sugested by JJM , We can use Fibo calculator for getting an Idea of where the point 5 is going to form.( Thanks JJM! )
Say, we observed that point 1 and 3 formed we can calculate with this Icharts tool propable value of point 5 which makes our task further easy.
If the wave is not reaching near that point and going in reverse direction we can leave that formation and search for another one.
For those who has never used this tool --- Check left side pane find Calculators and click it.You will get fibo calculator. cheers!
RK
|
|
| Back to top |
|
|
vinay28
Black Belt
Joined: 24 Dec 2010
Posts: 11748
|
| Post: #609 Posted: Sun Sep 25, 2011 9:26 pm Post subject: |
|
|
Sorry RK. Was out the whole day. Just saw your post
|
|
| Back to top |
|
|
rk_a2003
Black Belt
Joined: 21 Jan 2010
Posts: 2734
|
| Post: #610 Posted: Mon Sep 26, 2011 9:35 am Post subject: |
|
|
Hi All!
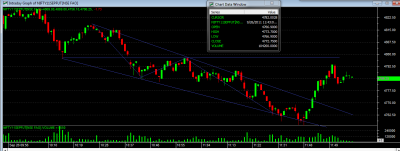
If Nifty reaches around 4865-4871 range check for -ww on 1m chart.
|
|
| Back to top |
|
|
rk_a2003
Black Belt
Joined: 21 Jan 2010
Posts: 2734
|
| Post: #611 Posted: Mon Sep 26, 2011 9:38 am Post subject: |
|
|
One can short at that range with a stop loss of 4876 for a target of 4845.
| rk_a2003 wrote: | Hi All!
If Nifty reaches around 4865-4871 range check for -ww on 1m chart. |
|
|
| Back to top |
|
|
rk_a2003
Black Belt
Joined: 21 Jan 2010
Posts: 2734
|
| Post: #612 Posted: Mon Sep 26, 2011 9:45 am Post subject: |
|
|
Sorry Guys!
This pattern appears to be withered away. Now no more valid.
| rk_a2003 wrote: | One can short at that range with a stop loss of 4876 for a target of 4845.
| rk_a2003 wrote: | Hi All!
If Nifty reaches around 4865-4871 range check for -ww on 1m chart. |
|
|
|
| Back to top |
|
|
sumesh_sol
Brown Belt
Joined: 06 Jun 2010
Posts: 2344
|
|
| Back to top |
|
|
Arjun20
Yellow Belt
Joined: 23 Jun 2011
Posts: 945
|
|
| Back to top |
|
|
rk_a2003
Black Belt
Joined: 21 Jan 2010
Posts: 2734
|
| Post: #615 Posted: Mon Sep 26, 2011 12:18 pm Post subject: |
|
|
Arjun !
It can be considered as DWW ( Distorted ) But quite often theese DWW's meet targets,especially in very lower time frames. It hapened in this case also.
Arj
un20 wrote: | SEniors,
can attached pattern be considered as valid?
I am pretty sure that , it's NOT a good one.
Still pls have a look |
|
|
| Back to top |
|
|
|