| View previous topic :: View next topic |
| Author |
RVG's 8 EMA HILO strategy |
amolghodekar
White Belt

Joined: 02 Apr 2011
Posts: 41
|
Post: #1  Posted: Tue Feb 14, 2012 3:58 pm Post subject: RVG's 8 EMA HILO strategy Posted: Tue Feb 14, 2012 3:58 pm Post subject: RVG's 8 EMA HILO strategy |
 |
|
From 18-Jan-2012 SB archives, I could find rules of RGV's 8EMA HILO strategy which are:
Plot 8ema,low and 8ema,high using live charts on hourly tf.
Now rules are:
1. When price crosses and closes above low ema from below ; tgt high ema
2. when price crosses and closes above high ema from below ; momentum is bullish
3. when price crosses and closes below high ema from above ; tgt low ema
4. when price crosses and closes below low ema from above ; momentum is bearish
I would really appreciate, if some-one or RGV himself can illustrate each point with chart so that it would clear entries, exits and SL....
Thanks
..Amol
|
|
| Back to top |
|
 |
|
|
 |
rvg
White Belt

Joined: 31 Oct 2006
Posts: 279
|
Post: #2  Posted: Tue Feb 14, 2012 4:16 pm Post subject: Transcripts from the SB Posted: Tue Feb 14, 2012 4:16 pm Post subject: Transcripts from the SB |
 |
|
Hello ; I have attached the relevant portions of the transcript from the SB Chat sessions. Hopefully they will help explain..
| Description: |
|

Download |
| Filename: |
8ema Hi Lo.xlsx |
| Filesize: |
10.04 KB |
| Downloaded: |
1114 Time(s) |
|
|
| Back to top |
|
 |
rvg
White Belt

Joined: 31 Oct 2006
Posts: 279
|
Post: #3  Posted: Tue Feb 14, 2012 4:27 pm Post subject: Re: Transcripts from the SB Posted: Tue Feb 14, 2012 4:27 pm Post subject: Re: Transcripts from the SB |
 |
|
| rvg wrote: | | Hello ; I have attached the relevant portions of the transcript from the SB Chat sessions. Hopefully they will help explain.. |
Excel Sheet is downloading as a zip file... Have attached in Plain Text format.
| Description: |
|

Download |
| Filename: |
8ema HiLo.txt |
| Filesize: |
2.3 KB |
| Downloaded: |
832 Time(s) |
|
|
| Back to top |
|
 |
smsmss
White Belt

Joined: 13 Oct 2009
Posts: 123
|
Post: #4  Posted: Tue Feb 14, 2012 5:12 pm Post subject: hi Posted: Tue Feb 14, 2012 5:12 pm Post subject: hi |
 |
|
| rvg i didnt get 8 ema low-high?, if possible can u post a chart?...thanx
|
|
| Back to top |
|
 |
GHAISAS
White Belt

Joined: 01 Feb 2010
Posts: 349
|
Post: #5  Posted: Tue Feb 14, 2012 5:23 pm Post subject: Posted: Tue Feb 14, 2012 5:23 pm Post subject: |
 |
|
| Dear rvg and amol, thanks for this strategy. However, unable to see chart as currently Live Charts only gives data for the last 20 days. The discussion quoted by you is of 07 January 2012. Is it possible to post the charts - to get the "feel"? Sincere thanks again to amol and rvg.
|
|
| Back to top |
|
 |
amolghodekar
White Belt

Joined: 02 Apr 2011
Posts: 41
|
Post: #6  Posted: Tue Feb 14, 2012 5:37 pm Post subject: Re: Transcripts from the SB Posted: Tue Feb 14, 2012 5:37 pm Post subject: Re: Transcripts from the SB |
 |
|
| rvg wrote: | | rvg wrote: | | Hello ; I have attached the relevant portions of the transcript from the SB Chat sessions. Hopefully they will help explain.. |
Excel Sheet is downloading as a zip file... Have attached in Plain Text format. |
Hi RVG,
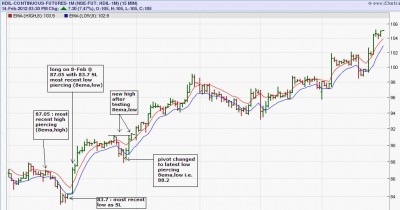
Thanks for posting transcript.... I tried applying rules what I understood from transcript, on HDIL 1M futures 15 Min. timeframe..please check chart and let me know whether markings are correct or not...
..Amol
| Description: |
|
| Filesize: |
72.51 KB |
| Viewed: |
1547 Time(s) |
|
|
|
| Back to top |
|
 |
sangi
White Belt

Joined: 19 Jan 2008
Posts: 69
|
Post: #7  Posted: Tue Feb 14, 2012 5:37 pm Post subject: Posted: Tue Feb 14, 2012 5:37 pm Post subject: |
 |
|
Hi RVGji,
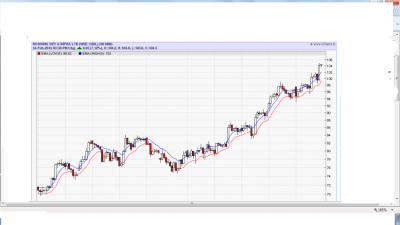
I am trying to explain this strategy with HDIL cash. Pls correct me if I am wrong.
1.This strategy is based on price action. No lower indicators .
2.We will trade in 15tf based on 60tf trend.
First, let us how to determine SAR. SAR means stop and reverse.
If a stock is in uptrend, (giving higher high and higher low)first identify the new high and the prior high. Then identify the last bar which went blow 8 ema low. The low of such bar is sae, upside pivot.
I hv attached 60tf hdil cash. ON Feb, 6 hdil 60tf sar, down pivot , 83.3 was broken at 9.59 candle. One shd buy hdil at 83.5(83.3 plus .20ps filter) with sl as 78.9. 78.9 why?
As I said earlier we r trading in 15tf. The last bar which went blow 8ema before hitting 83.3 in 15tf was feb 3 3.30 candle. The low of the candle is 78.9.
Feb 6 11 am candle gave a high of 87.15. then on feb 8 only we got a reco high at 10 am candle. Now the sar will be raised to 83.5 feb 7 3.30, candle.
Profit taking depends on one’s trade mgmt.. one can book profit based on r:r ratio or keep trailing as we get new pivot if the stk is trending.
Hope I hv explained clearly. RVGji, ur supervision is needed.
Regards,
Sangi
|
|
| Back to top |
|
 |
sangi
White Belt

Joined: 19 Jan 2008
Posts: 69
|
Post: #8  Posted: Tue Feb 14, 2012 5:39 pm Post subject: Posted: Tue Feb 14, 2012 5:39 pm Post subject: |
 |
|
here is the chart.
| Description: |
|
| Filesize: |
113.8 KB |
| Viewed: |
727 Time(s) |
|
|
|
| Back to top |
|
 |
rvg
White Belt

Joined: 31 Oct 2006
Posts: 279
|
Post: #9  Posted: Tue Feb 14, 2012 5:43 pm Post subject: Today's Chart Posted: Tue Feb 14, 2012 5:43 pm Post subject: Today's Chart |
 |
|
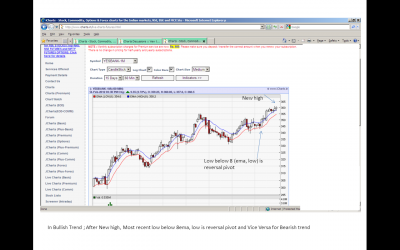
Have posted todays chart for YesBank with the markings.. Hope this helps
| Description: |
|
| Filesize: |
265.41 KB |
| Viewed: |
1086 Time(s) |
|
|
|
| Back to top |
|
 |
rvg
White Belt

Joined: 31 Oct 2006
Posts: 279
|
Post: #10  Posted: Tue Feb 14, 2012 5:49 pm Post subject: Re: Transcripts from the SB Posted: Tue Feb 14, 2012 5:49 pm Post subject: Re: Transcripts from the SB |
 |
|
| amolghodekar wrote: |
Hi RVG,
Thanks for posting transcript.... I tried applying rules what I understood from transcript, on HDIL 1M futures 15 Min. timeframe..please check chart and let me know whether markings are correct or not...
..Amol |
Yes this looks correct .. you will have to experiment with different scrips and the timeframes to suit your trading style.
But remember to sync the lower timeframe with the higher timeframe if you want to carry the trade. All the best..
|
|
| Back to top |
|
 |
rvg
White Belt

Joined: 31 Oct 2006
Posts: 279
|
Post: #11  Posted: Tue Feb 14, 2012 5:51 pm Post subject: Posted: Tue Feb 14, 2012 5:51 pm Post subject: |
 |
|
| sangi wrote: | Hi RVGji,
Hope I hv explained clearly. RVGji, ur supervision is needed.
|
Amol has clearly marked all the points in his chart.. pls go thru that.
All the best
|
|
| Back to top |
|
 |
GHAISAS
White Belt

Joined: 01 Feb 2010
Posts: 349
|
Post: #12  Posted: Tue Feb 14, 2012 5:55 pm Post subject: Posted: Tue Feb 14, 2012 5:55 pm Post subject: |
 |
|
rvg, thanks for todays chart. earlier data for 7th january 2012 was saturday - only for 2 hours testing by nse. That too - not available because our data is only for 20 days backward from today. Any way, thanks rvg and amol.
RVG and amol current charts very elaborative. thanks.
|
|
| Back to top |
|
 |
rvg
White Belt

Joined: 31 Oct 2006
Posts: 279
|
Post: #13  Posted: Tue Feb 14, 2012 6:14 pm Post subject: Posted: Tue Feb 14, 2012 6:14 pm Post subject: |
 |
|
This is an always in the trade system. Please keep appropriate filter in your reversible pivots.
If you wish to enter a trend midway, trade @ a lower timeframe and carry the trade if the trend is in sync with higher timeframe.
I usually plot the 8 and 34 ema bands on Daily and Weekly charts to get a feel of the larger trend.
All the best
|
|
| Back to top |
|
 |
amolghodekar
White Belt

Joined: 02 Apr 2011
Posts: 41
|
Post: #14  Posted: Tue Feb 14, 2012 7:30 pm Post subject: Posted: Tue Feb 14, 2012 7:30 pm Post subject: |
 |
|
| rvg wrote: | This is an always in the trade system. Please keep appropriate filter in your reversible pivots.
If you wish to enter a trend midway, trade @ a lower timeframe and carry the trade if the trend is in sync with higher timeframe.
I usually plot the 8 and 34 ema bands on Daily and Weekly charts to get a feel of the larger trend.
All the best |
Could you please explain above statement (marked in bold)... as this most important...
..Amol
|
|
| Back to top |
|
 |
rvg
White Belt

Joined: 31 Oct 2006
Posts: 279
|
Post: #15  Posted: Wed Feb 15, 2012 3:56 pm Post subject: Posted: Wed Feb 15, 2012 3:56 pm Post subject: |
 |
|
| amolghodekar wrote: | I usually plot the 8 and 34 ema bands on Daily and Weekly charts to get a feel of the larger trend.
|
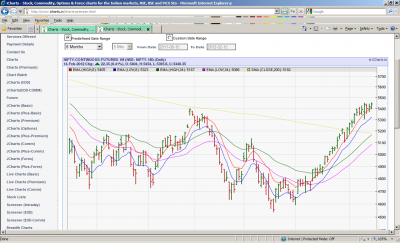
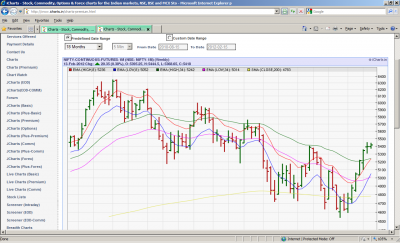
Observe how NF moves within the EMA bands..
You can plot the Daily and weekly charts using Charts (Premium)
Keep in mind the following statements especially when seeing weekly charts
1. When price crosses and closes above low ema from below ; tgt high ema
2. when price crosses and closes above high ema from below ; momentum is bullish
3. when price crosses and closes below high ema from above ; tgt low ema
4. when price crosses and closes below low ema from above ; momentum is bearish
These statements can apply universally across all tfs and ema bands
| Description: |
|
| Filesize: |
232.24 KB |
| Viewed: |
814 Time(s) |
|
| Description: |
|
| Filesize: |
239.69 KB |
| Viewed: |
573 Time(s) |
|
|
|
| Back to top |
|
 |
|

