| View previous topic :: View next topic |
| Author |
scocks screening strategies |
rrk2006hyd
Yellow Belt

Joined: 13 Oct 2010
Posts: 874
|
Post: #1  Posted: Fri Jun 24, 2011 3:29 pm Post subject: scocks screening strategies Posted: Fri Jun 24, 2011 3:29 pm Post subject: scocks screening strategies |
 |
|
Helloo..friends...following are the strategies for intra/delivery stock screeners..comments are welcome..
1. close>(open+high+low)/3 for delivery or swing
2.last>(open+high+low)/3 for intraday.
thx..

|
|
| Back to top |
|
 |
|
|
|
rk_a2003
Black Belt

Joined: 21 Jan 2010
Posts: 2734
|
| Post: #2 Posted: Fri Jun 24, 2011 3:38 pm Post subject: Re: scocks screening strategies |
|
|
| rrk2006hyd wrote: | Helloo..friends...following are the strategies for intra/delivery stock screeners..comments are welcome..
1. close>(open+high+low)/3 for delivery or swing
2.last>(open+high+low)/3 for intraday.
thx..
|
rrk2006hyd could you please explain with some specific examples. Thank you!
|
|
| Back to top |
|
|
rrk2006hyd
Yellow Belt
Joined: 13 Oct 2010
Posts: 874
|
| Post: #3 Posted: Fri Jun 24, 2011 4:03 pm Post subject: Re: scocks screening strategies |
|
|
| rrk2006hyd wrote: | Helloo..friends...following are the strategies for intra/delivery stock screeners..comments are welcome..
1. close>(open+high+low)/3 for delivery or swing
2.last>(open+high+low)/3 for intraday.
thx..
|
ex1: take any stock say ongc on 23rd,
open=260
high=269.10
low=258.25
now calculate p=(open+high+low)/3 like pivot..
here p=(260+269.10+258.25)/3= 262.45
ongc closed on 23rd at 264.65,so close> 262.45..
so it is bullish for next trading..u can hold for some time..
today i.e on 24th ongc opened at
NSE data:
open=269,
high=275.40
low=269
last price=273.05, and u can hold for some more days..
it is like calculating pivot table..but here we are using close>p
same for intraday also but we are looking for last price ,if last price>p then we can buy with other indicators confirmation.
..
|
|
| Back to top |
|
|
Mahadev22
White Belt

Joined: 03 Apr 2009
Posts: 1
|
| Post: #4 Posted: Fri Jun 24, 2011 4:25 pm Post subject: |
|
|
Sir
What is the success ratio of this method ?
What about shorting?
|
|
| Back to top |
|
|
vinay28
Black Belt
Joined: 24 Dec 2010
Posts: 11748
|
| Post: #5 Posted: Fri Jun 24, 2011 7:57 pm Post subject: |
|
|
Thanks. I have two doubts
1. Suppose ongc had not closed above "p" but was above "p" at some time next day, then it becomes a intraday buy right?
2. Should it not apply to nifty also?
|
|
| Back to top |
|
|
rrk2006hyd
Yellow Belt
Joined: 13 Oct 2010
Posts: 874
|
| Post: #6 Posted: Sat Jun 25, 2011 10:00 am Post subject: |
|
|
| vinay28 wrote: | Thanks. I have two doubts
1. Suppose ongc had not closed above "p" but was above "p" at some time next day, then it becomes a intraday buy right?
2. Should it not apply to nifty also? |
1.if ongc had not closed above "p" you can short.
2. You can apply it to nifty also.
if you are looking for short ,look for stocks those close<"p".
3.for intraday last price(LTP)>p for buying and LTP<p for short sell..
...
|
|
| Back to top |
|
|
vinay28
Black Belt
Joined: 24 Dec 2010
Posts: 11748
|
| Post: #7 Posted: Sat Jun 25, 2011 11:54 am Post subject: |
|
|
Thanks, but aren't your answers 1 and 3 contradictory to my question 1?
If ongc does not close above p on first day, you say that I should short it next day but if next day it is above p intraday, you say buy. The latter was my exactly my question.
|
|
| Back to top |
|
|
rrk2006hyd
Yellow Belt
Joined: 13 Oct 2010
Posts: 874
|
| Post: #8 Posted: Sat Jun 25, 2011 2:35 pm Post subject: |
|
|
| vinay28 wrote: | Thanks, but aren't your answers 1 and 3 contradictory to my question 1?
If ongc does not close above p on first day, you say that I should short it next day but if next day it is above p intraday, you say buy. The latter was my exactly my question. |
yes..your first question..if next day it is above p..that is intraday buy...yes..it becomes intraday buy.so, u can buy that stock..for intraday..
|
|
| Back to top |
|
|
vinay28
Black Belt
Joined: 24 Dec 2010
Posts: 11748
|
| Post: #9 Posted: Sat Jun 25, 2011 8:24 pm Post subject: |
|
|
Many thanks rrk2006hyd. However, I wonder whether it will help us every day. For example, nifty future closed at 5485, way above "p" (5390.79) on friday (24th June) and will only have to be above "p" on monday (27th June) to trigger a buy as per your strategy. But that 's way too low below friday's closing and may give a false signal?
You valued comments will help. May be in such cases, Avinash's intraday strategy based on NF values as of 9.30 am will suit better?
|
|
| Back to top |
|
|
maneesh007
White Belt
Joined: 08 Feb 2009
Posts: 119
|
| Post: #10 Posted: Sat Jun 25, 2011 9:28 pm Post subject: |
|
|
Dear rrk,
what abt SLs...friend plzz eleborate
warm regards
Maneesh Bhardwaj
|
|
| Back to top |
|
|
rrk2006hyd
Yellow Belt
Joined: 13 Oct 2010
Posts: 874
|
| Post: #11 Posted: Sun Jun 26, 2011 5:33 pm Post subject: |
|
|
| vinay28 wrote: | Many thanks rrk2006hyd. However, I wonder whether it will help us every day. For example, nifty future closed at 5485, way above "p" (5390.79) on friday (24th June) and will only have to be above "p" on monday (27th June) to trigger a buy as per your strategy. But that 's way too low below friday's closing and may give a false signal?
You valued comments will help. May be in such cases, Avinash's intraday strategy based on NF values as of 9.30 am will suit better? |
thanks for replys,
1.for Inrtaday..use 5,10,15 mnts time frames and take opne,high and low..
calculate p=(open+high+low)/3..
if LTP>p then buy..
2.for swing take CLOSE prices ..
thq..
|
|
| Back to top |
|
|
rrk2006hyd
Yellow Belt
Joined: 13 Oct 2010
Posts: 874
|
| Post: #12 Posted: Sun Jun 26, 2011 5:40 pm Post subject: |
|
|
| maneesh007 wrote: | Dear rrk,
what abt SLs...friend plzz eleborate
warm regards
Maneesh Bhardwaj |
hi..
for SLs..use
1. after calculating P=(open+high+low)/3 ,P will be the Stop Loss Price,if CLose<P then u think to come out..for swing/delivery, for intraday LTP<P then come out.
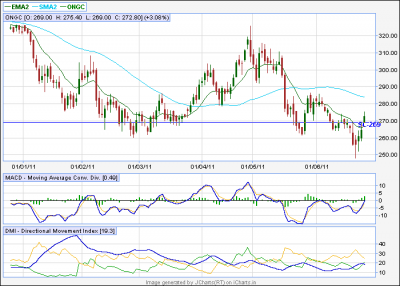
2.Swing high and swing low..i'm attaching ONGC chart..
3.use ema 39 and sma 50 combo for swing high and swing low or ema13/sma39.both gives good signals..
| Description: |
|
| Filesize: |
16.24 KB |
| Viewed: |
608 Time(s) |
|
Last edited by rrk2006hyd on Mon Jun 27, 2011 3:23 pm; edited 1 time in total |
|
| Back to top |
|
|
vinay28
Black Belt
Joined: 24 Dec 2010
Posts: 11748
|
| Post: #13 Posted: Sun Jun 26, 2011 8:51 pm Post subject: |
|
|
| Thanks. You mean "p" of previous day for investment and of that a particular moment during the day for intraday?
|
|
| Back to top |
|
|
opportunist
White Belt
Joined: 27 Apr 2010
Posts: 356
|
| Post: #14 Posted: Sun Jun 26, 2011 11:19 pm Post subject: |
|
|
Prima facie the method seems to work. I checked with nifty at a glance. for last one month data..... when there is a trend it works accurately (that is go long when close > p and short when close <p)
However, a more extensive back testing may be required for checking out the effectiveness of this method and determine the percentage of successful prediction
|
|
| Back to top |
|
|
rrk2006hyd
Yellow Belt
Joined: 13 Oct 2010
Posts: 874
|
| Post: #15 Posted: Mon Jun 27, 2011 12:33 pm Post subject: |
|
|
| vinay28 wrote: | | Thanks. You mean "p" of previous day for investment and of that a particular moment during the day for intraday? |
1.yes. ..to day ,i.e 27/06/2011,ONGC trading at 285.45 at,12.32PM. Friday closed at 272.80.
|
|
| Back to top |
|
|
|


