| View previous topic :: View next topic |
| Author |
Select Stock picks |
rvg
White Belt

Joined: 31 Oct 2006
Posts: 279
|
Post: #16  Posted: Wed Sep 08, 2010 5:24 pm Post subject: Renuka Sugars Posted: Wed Sep 08, 2010 5:24 pm Post subject: Renuka Sugars |
 |
|
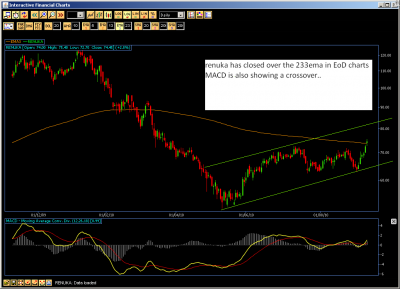
Renuka Sugars has closed over the 233 EMA in the EoD charts.. Should pave way for good trading opportunities in the stock now.
| Description: |
|
| Filesize: |
51.33 KB |
| Viewed: |
409 Time(s) |
|
|
|
| Back to top |
|
 |
|
|
 |
rvg
White Belt

Joined: 31 Oct 2006
Posts: 279
|
Post: #17  Posted: Wed Sep 08, 2010 5:40 pm Post subject: Godrej Industries Posted: Wed Sep 08, 2010 5:40 pm Post subject: Godrej Industries |
 |
|
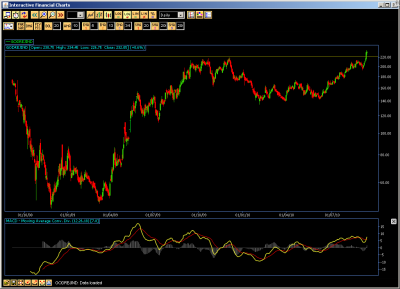
Godrej Industries has crossed over major resistance area 220.. which should now become support in future...
| Description: |
|
| Filesize: |
47.07 KB |
| Viewed: |
411 Time(s) |
|
|
|
| Back to top |
|
 |
rvg
White Belt

Joined: 31 Oct 2006
Posts: 279
|
Post: #18  Posted: Wed Sep 08, 2010 6:35 pm Post subject: KPIT Hourly Conflu in the making Posted: Wed Sep 08, 2010 6:35 pm Post subject: KPIT Hourly Conflu in the making |
 |
|
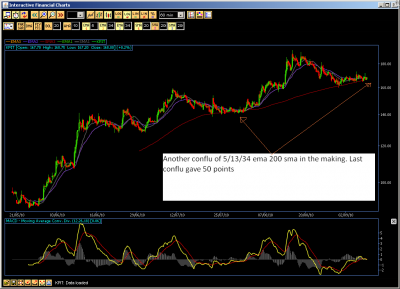
Hourly Conflu coming up in KPIT... last one gave 50 pts.
| Description: |
|
| Filesize: |
66.43 KB |
| Viewed: |
471 Time(s) |
|
|
|
| Back to top |
|
 |
sinhaalok
White Belt

Joined: 21 Feb 2010
Posts: 15
|
Post: #19  Posted: Wed Sep 08, 2010 7:41 pm Post subject: Posted: Wed Sep 08, 2010 7:41 pm Post subject: |
 |
|
thanks rvg for sharing it with us  just wanted to know after a confluence is it always a BO or can there be a BD also just wanted to know after a confluence is it always a BO or can there be a BD also
|
|
| Back to top |
|
 |
rvg
White Belt

Joined: 31 Oct 2006
Posts: 279
|
Post: #20  Posted: Wed Sep 08, 2010 11:17 pm Post subject: BO or BD Posted: Wed Sep 08, 2010 11:17 pm Post subject: BO or BD |
 |
|
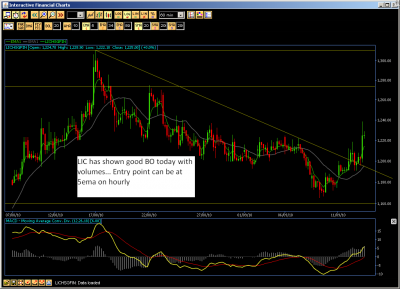
| Surely there can be a breakdown also after Conflu... See LICHSGFIN Today
|
|
| Back to top |
|
 |
will_recover
White Belt

Joined: 19 Aug 2010
Posts: 55
|
Post: #21  Posted: Wed Sep 08, 2010 11:31 pm Post subject: Re: Godrej Industries Posted: Wed Sep 08, 2010 11:31 pm Post subject: Re: Godrej Industries |
 |
|
| rvgandhi wrote: | | Godrej Industries has crossed over major resistance area 220.. which should now become support in future... |
further upside expected?
|
|
| Back to top |
|
 |
Sanchit
White Belt

Joined: 03 Jul 2010
Posts: 46
|
Post: #22  Posted: Thu Sep 09, 2010 10:36 am Post subject: Re: Renuka Sugars Posted: Thu Sep 09, 2010 10:36 am Post subject: Re: Renuka Sugars |
 |
|
| rvgandhi wrote: | | Renuka Sugars has closed over the 233 EMA in the EoD charts.. Should pave way for good trading opportunities in the stock now. |
Hi RVG,
Could you please elaborate on the significance of 233 EMA?
Regards,
Sanchit
|
|
| Back to top |
|
 |
rvg
White Belt

Joined: 31 Oct 2006
Posts: 279
|
Post: #23  Posted: Thu Sep 09, 2010 12:19 pm Post subject: significance of 233 EMA Posted: Thu Sep 09, 2010 12:19 pm Post subject: significance of 233 EMA |
 |
|
| its just another fibonacci number.. what I meant to say that it has crossed the major fibonacci emas. These usually act as support/resistances.
|
|
| Back to top |
|
 |
priyabalan
White Belt

Joined: 31 Dec 2009
Posts: 22
|
Post: #24  Posted: Thu Sep 09, 2010 12:34 pm Post subject: about Tcs Posted: Thu Sep 09, 2010 12:34 pm Post subject: about Tcs |
 |
|
Hi RVG,
I am holding long in Tcs @ Rs 867. Can you pls let me know what do i do know as it has come down from the high levels of 885.
Thanks & regards
priya
|
|
| Back to top |
|
 |
rvg
White Belt

Joined: 31 Oct 2006
Posts: 279
|
Post: #25  Posted: Thu Sep 09, 2010 12:50 pm Post subject: holding long in Tcs @ Rs 867 Posted: Thu Sep 09, 2010 12:50 pm Post subject: holding long in Tcs @ Rs 867 |
 |
|
| Please post a chart indicating your trade setup.. I can then comment.. as your setup and expectations may vary from mine
|
|
| Back to top |
|
 |
rvg
White Belt

Joined: 31 Oct 2006
Posts: 279
|
Post: #26  Posted: Mon Sep 13, 2010 4:22 pm Post subject: Sesa Goa Posted: Mon Sep 13, 2010 4:22 pm Post subject: Sesa Goa |
 |
|
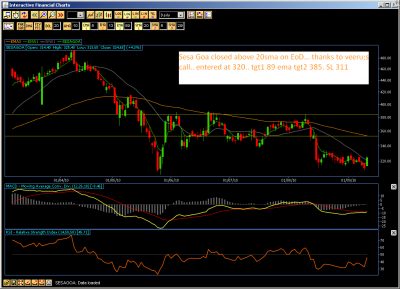
Thanks to Veeru for this call.. had it on my watchlist but entered on Veeru's post on the SB
| Description: |
|
| Filesize: |
67.69 KB |
| Viewed: |
496 Time(s) |
|
|
|
| Back to top |
|
 |
rvg
White Belt

Joined: 31 Oct 2006
Posts: 279
|
Post: #27  Posted: Mon Sep 13, 2010 4:53 pm Post subject: LICHSGFin Hourly Posted: Mon Sep 13, 2010 4:53 pm Post subject: LICHSGFin Hourly |
 |
|
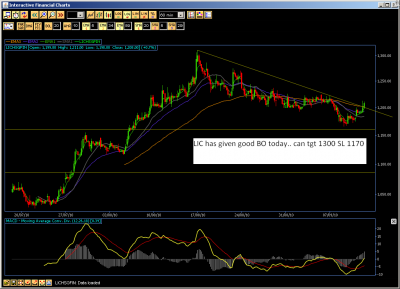
Good BO on Hourly.. tgt 1300+ SL 1170
| Description: |
|
| Filesize: |
67.17 KB |
| Viewed: |
478 Time(s) |
|
|
|
| Back to top |
|
 |
rvg
White Belt

Joined: 31 Oct 2006
Posts: 279
|
Post: #28  Posted: Tue Sep 14, 2010 3:50 pm Post subject: Few charts Posted: Tue Sep 14, 2010 3:50 pm Post subject: Few charts |
 |
|
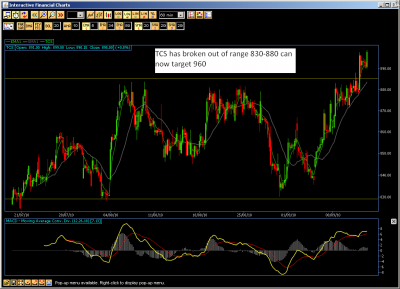
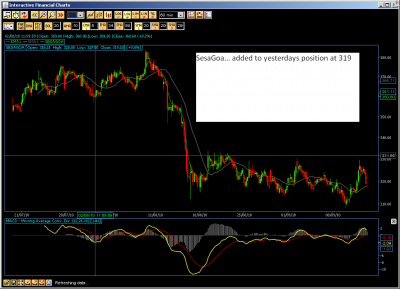
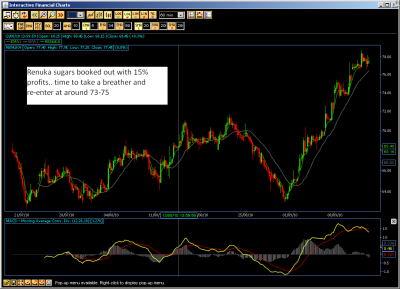
Attached few charts.. comments are welcome
| Description: |
|
| Filesize: |
71.32 KB |
| Viewed: |
401 Time(s) |
|
| Description: |
|
| Filesize: |
63.41 KB |
| Viewed: |
420 Time(s) |
|
| Description: |
|
| Filesize: |
67.73 KB |
| Viewed: |
400 Time(s) |
|
| Description: |
|
| Filesize: |
69.39 KB |
| Viewed: |
386 Time(s) |
|
|
|
| Back to top |
|
 |
aapatel
White Belt

Joined: 20 Jun 2009
Posts: 2
|
Post: #29  Posted: Tue Sep 14, 2010 6:50 pm Post subject: I CHART Posted: Tue Sep 14, 2010 6:50 pm Post subject: I CHART |
 |
|
SWING TRADER:
I WAS REFERING TCS - INTRADAY CHART. THE TIME FRAME IS 60 MIN. AND WORKING DAYS PROBABLY 34.
CAN YOU GIVE THE PROCESS HOW TO PRESENT LIKE THIS.
REGARDS
A.A.PATEL
|
|
| Back to top |
|
 |
sinhaalok
White Belt

Joined: 21 Feb 2010
Posts: 15
|
Post: #30  Posted: Tue Sep 14, 2010 9:53 pm Post subject: Re: LICHSGFin Hourly Posted: Tue Sep 14, 2010 9:53 pm Post subject: Re: LICHSGFin Hourly |
 |
|
enjoyed the BO of LIC thanks RVG...  | rvgandhi wrote: | | Good BO on Hourly.. tgt 1300+ SL 1170 |
|
|
| Back to top |
|
 |
|

