| View previous topic :: View next topic |
| Author |
SENSEX & NIFTY CHART |
r.dibya
White Belt

Joined: 26 Jun 2008
Posts: 79
|
Post: #16  Posted: Mon Aug 31, 2009 12:42 am Post subject: Posted: Mon Aug 31, 2009 12:42 am Post subject: |
 |
|
i think copper trading range is 325/330---285/90 range for 1 to 2 months. befor take in long postion 317 levels is a psychological falling level. so don't add in this level ,short near 325/330 or buy near for shortterm 303/290-85 level
zinc bullish above 94.50 tgt. 110 ,gold maybe down from 15500 level
|
|
| Back to top |
|
 |
|
|  |
r.dibya
White Belt

Joined: 26 Jun 2008
Posts: 79
|
Post: #17  Posted: Tue Sep 01, 2009 6:28 pm Post subject: Posted: Tue Sep 01, 2009 6:28 pm Post subject: |
 |
|
15 min. chart of nifty, i think nifty may take support near 4590-4600 level tgt. 4650 .if nifty fall below 4590 then tgt. is 4510.
according to me nifty should touch 4510-4540 level this is strong support line ( buy nifty around 4520 sl 4440 tgt. 4760-70/5000/5200)
if nifty fall below this level 4500 & trading 1 or 2 days below this level tgt. 4370/4100/3900/3600
| Description: |
|
| Filesize: |
31.55 KB |
| Viewed: |
478 Time(s) |

|
|
|
| Back to top |
|
 |
r.dibya
White Belt

Joined: 26 Jun 2008
Posts: 79
|
Post: #18  Posted: Tue Sep 01, 2009 6:41 pm Post subject: Posted: Tue Sep 01, 2009 6:41 pm Post subject: |
 |
|
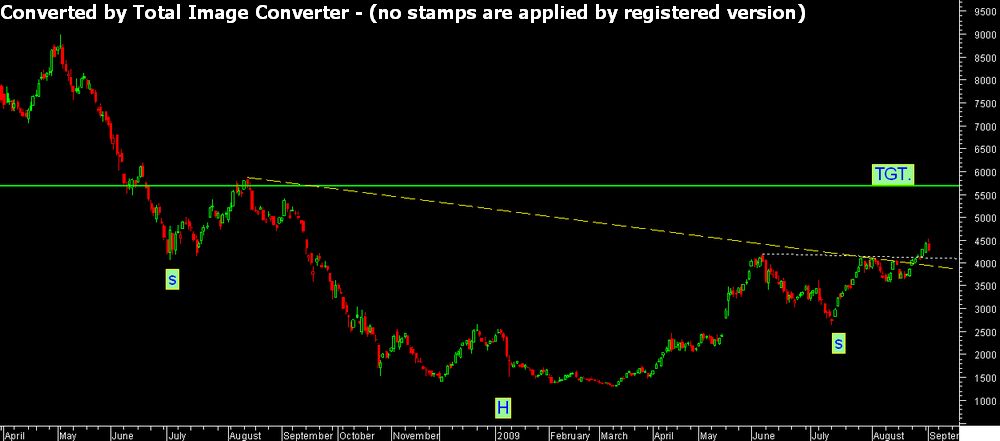
BSE REALTY INDEX ((((H&S PATTERN INDICATES HUGE BULLISH
I AM BULLISH ON ------UNITECH,DLF ETC.
| Description: |
|
| Filesize: |
44.44 KB |
| Viewed: |
2943 Time(s) |

|
|
|
| Back to top |
|
 |
r.dibya
White Belt

Joined: 26 Jun 2008
Posts: 79
|
Post: #19  Posted: Tue Sep 01, 2009 6:43 pm Post subject: Posted: Tue Sep 01, 2009 6:43 pm Post subject: |
 |
|
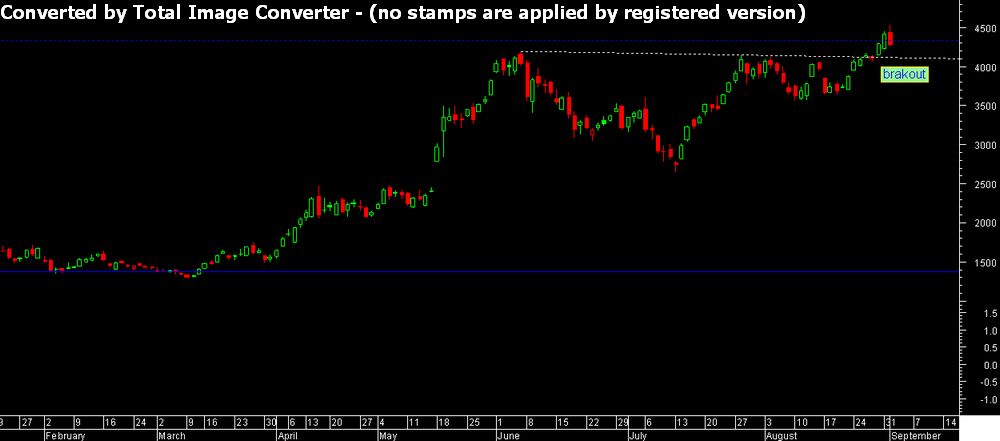
BSE REALTY INDEX IN DAILY CHART
| Description: |
|
| Filesize: |
40.68 KB |
| Viewed: |
2941 Time(s) |

|
|
|
| Back to top |
|
 |
r.dibya
White Belt

Joined: 26 Jun 2008
Posts: 79
|
Post: #20  Posted: Tue Sep 01, 2009 6:48 pm Post subject: Posted: Tue Sep 01, 2009 6:48 pm Post subject: |
 |
|
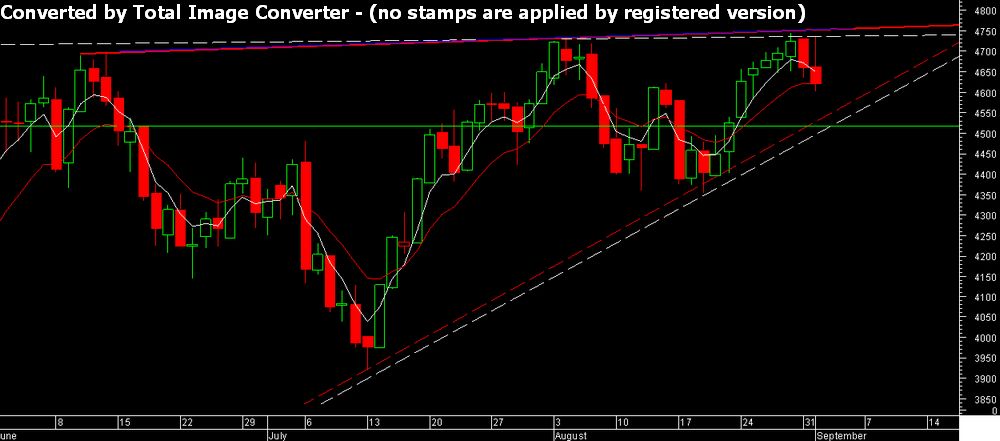
NIFTY CHART,,,,,
BEFORE TAKE SHORT POSITION PLZ BE CAREFUL FOR REALTY INDEX.
STRONG SUPPORT NEAR 4500 BUT AT THAT MOMENT LOOK AT ON BSE REALTY INDEX ( IT IS IN ABOVE BEARKOUT POSITION OR NOT)
RELIANCE STRONG SUPPORT NEAR 1920-1930 LEVEL
| Description: |
|
| Filesize: |
58.03 KB |
| Viewed: |
2939 Time(s) |

|
|
|
| Back to top |
|
 |
|
|
You cannot post new topics in this forum
You cannot reply to topics in this forum
You cannot edit your posts in this forum
You cannot delete your posts in this forum
You cannot vote in polls in this forum
You can attach files in this forum
You can download files in this forum
|
Powered by phpBB © 2001, 2005 phpBB Group
|
|

