| View previous topic :: View next topic |
| Author |
SENSEX & NIFTY CHART |
r.dibya
White Belt

Joined: 26 Jun 2008
Posts: 79
|
Post: #1  Posted: Sat Aug 22, 2009 4:20 pm Post subject: SENSEX & NIFTY CHART Posted: Sat Aug 22, 2009 4:20 pm Post subject: SENSEX & NIFTY CHART |
 |
|
1) INVERTED H&S PATTERN-----BULLISH
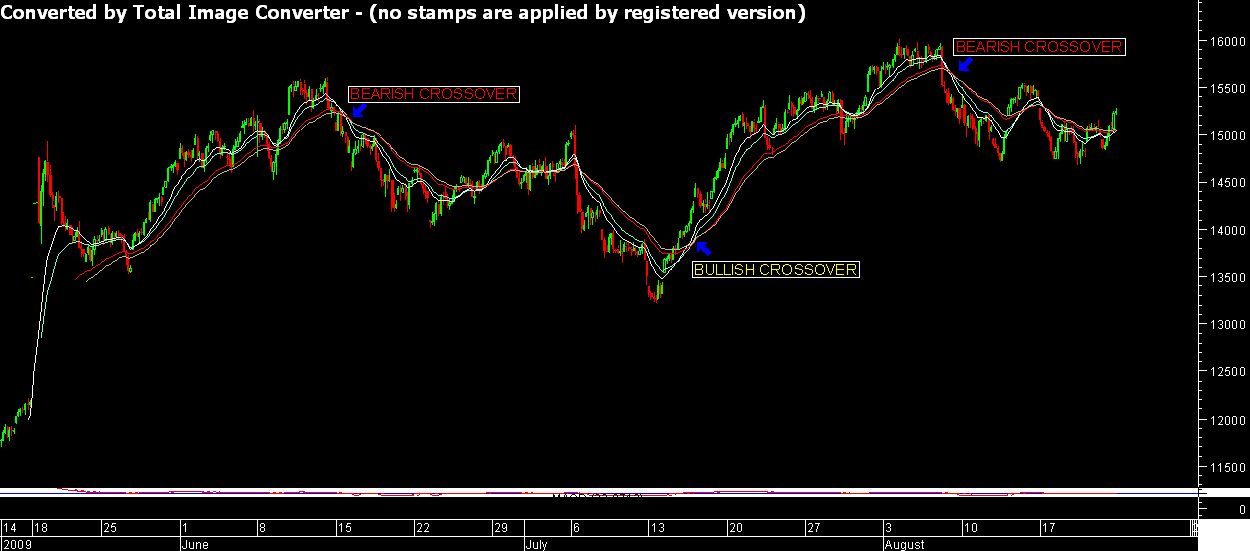
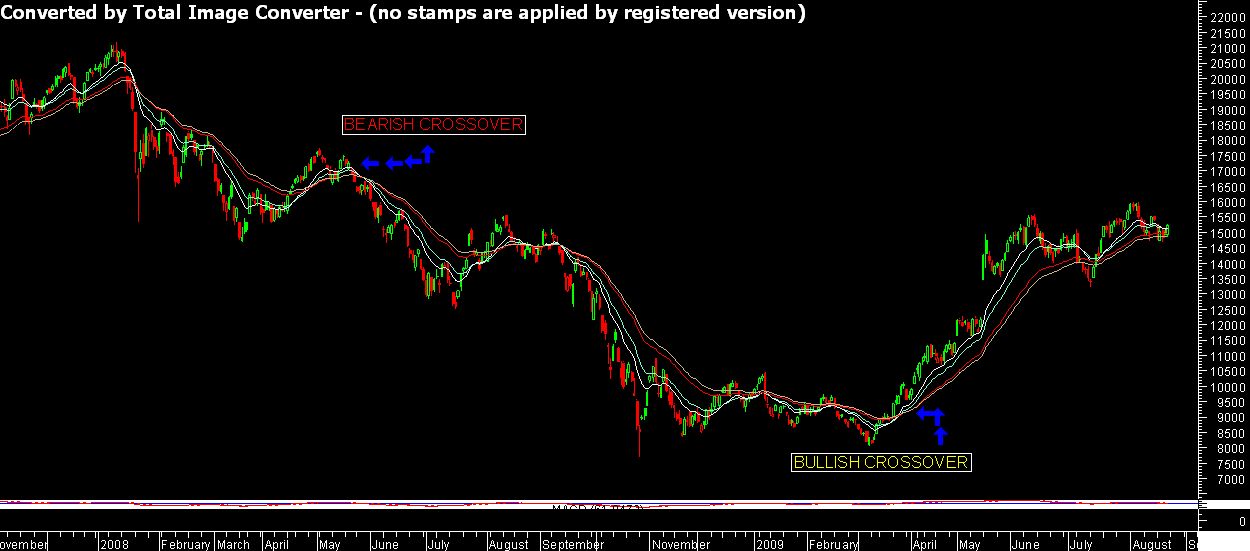
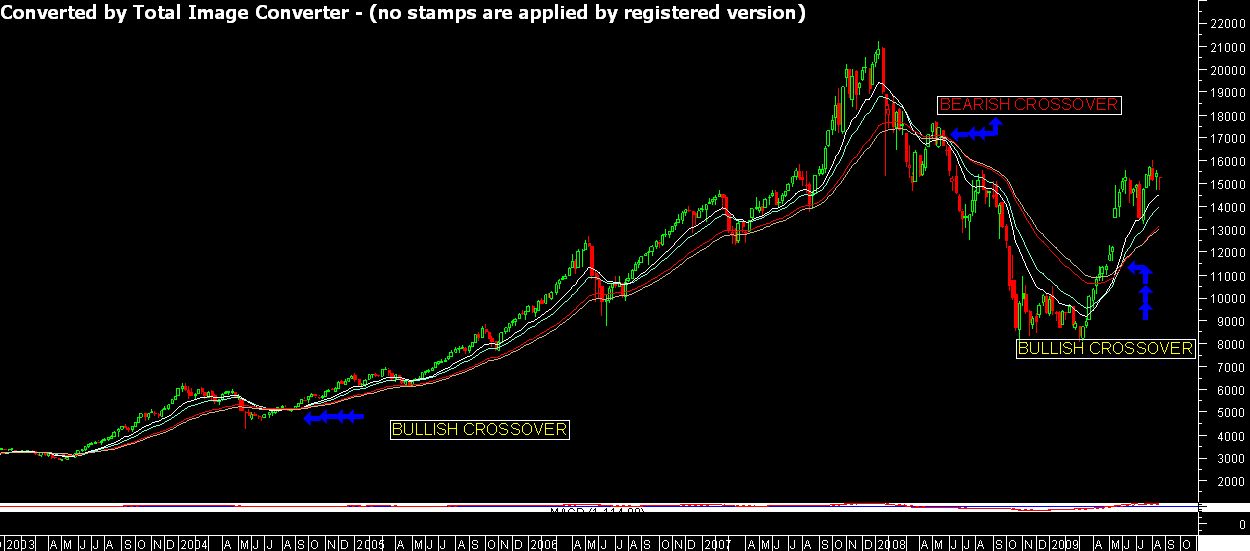
2)CROSSOVER (MOVING AVG.)---BULLISH OR BEARISH
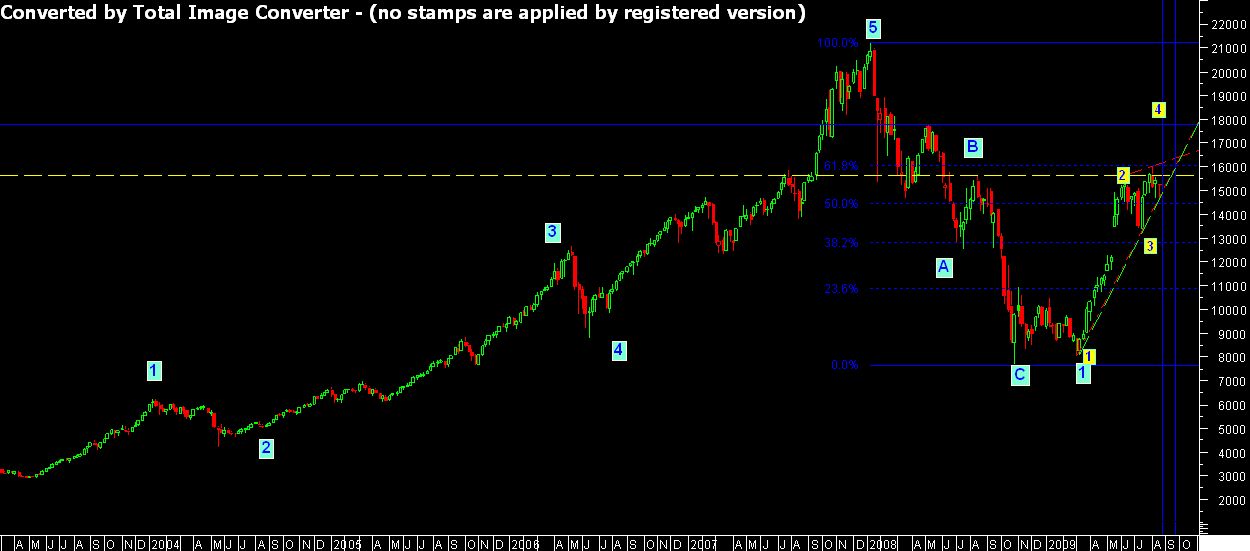
3)ELLIOT WAVE THEORY---PREDICT NEXT TREND
I AM USEING 3 INDICATOR TO KNOW THE MARKET ANALYSIS
u can go through by LINK----http://www.sendspace.com/file/o0vd4h ------copy & paste in another website
please use WINRAR ARCHIEVE TO be DOWNLOAD THE FOLDER
IF anything is wrong there so kindly convey me by this chart
|
|
| Back to top |
|
 |
|
|
 |
knrajan31
White Belt

Joined: 01 Apr 2009
Posts: 18
|
Post: #2  Posted: Sun Aug 23, 2009 7:58 am Post subject: 3point strategy Posted: Sun Aug 23, 2009 7:58 am Post subject: 3point strategy |
 |
|
since i have noticed today about your 3 system strategy i am unable to down load due to time lapse.can you please up load again
thanks
gknagaraj.
|
|
| Back to top |
|
 |
r.dibya
White Belt

Joined: 26 Jun 2008
Posts: 79
|
Post: #3  Posted: Sun Aug 23, 2009 11:52 pm Post subject: Posted: Sun Aug 23, 2009 11:52 pm Post subject: |
 |
|
((( copy of --http://www.sendspace.com/file/o0vd4h and paste to another website)))
after u will get folder link from sendspace.com----Download Link: New Folder.rar
download this folder , if u know how to use winzip then u can creat folder chart -- sensex & nifty chart r stored in the winzip file.
or
leave ur email-id here so that i can send to ur mail to that link
|
|
| Back to top |
|
 |
r.dibya
White Belt

Joined: 26 Jun 2008
Posts: 79
|
Post: #4  Posted: Mon Aug 24, 2009 4:44 pm Post subject: Posted: Mon Aug 24, 2009 4:44 pm Post subject: |
 |
|
see 1hr. sensex chart with MA
| Description: |
|
| Filesize: |
79.1 KB |
| Viewed: |
7251 Time(s) |
|
|
|
| Back to top |
|
 |
r.dibya
White Belt

Joined: 26 Jun 2008
Posts: 79
|
Post: #5  Posted: Mon Aug 24, 2009 4:55 pm Post subject: Posted: Mon Aug 24, 2009 4:55 pm Post subject: |
 |
|
see daily sensex bullish crossover
| Description: |
|
| Filesize: |
92.64 KB |
| Viewed: |
7284 Time(s) |
|
|
|
| Back to top |
|
 |
r.dibya
White Belt

Joined: 26 Jun 2008
Posts: 79
|
Post: #6  Posted: Mon Aug 24, 2009 4:57 pm Post subject: Posted: Mon Aug 24, 2009 4:57 pm Post subject: |
 |
|
sensex bullish & bearish crossover
| Description: |
|
| Filesize: |
86.29 KB |
| Viewed: |
7308 Time(s) |
|
|
|
| Back to top |
|
 |
r.dibya
White Belt

Joined: 26 Jun 2008
Posts: 79
|
Post: #7  Posted: Mon Aug 24, 2009 5:06 pm Post subject: Posted: Mon Aug 24, 2009 5:06 pm Post subject: |
 |
|
sensex elliot wave
| Description: |
|
| Filesize: |
72.87 KB |
| Viewed: |
7335 Time(s) |
|
|
|
| Back to top |
|
 |
r.dibya
White Belt

Joined: 26 Jun 2008
Posts: 79
|
Post: #8  Posted: Mon Aug 24, 2009 5:07 pm Post subject: Posted: Mon Aug 24, 2009 5:07 pm Post subject: |
 |
|
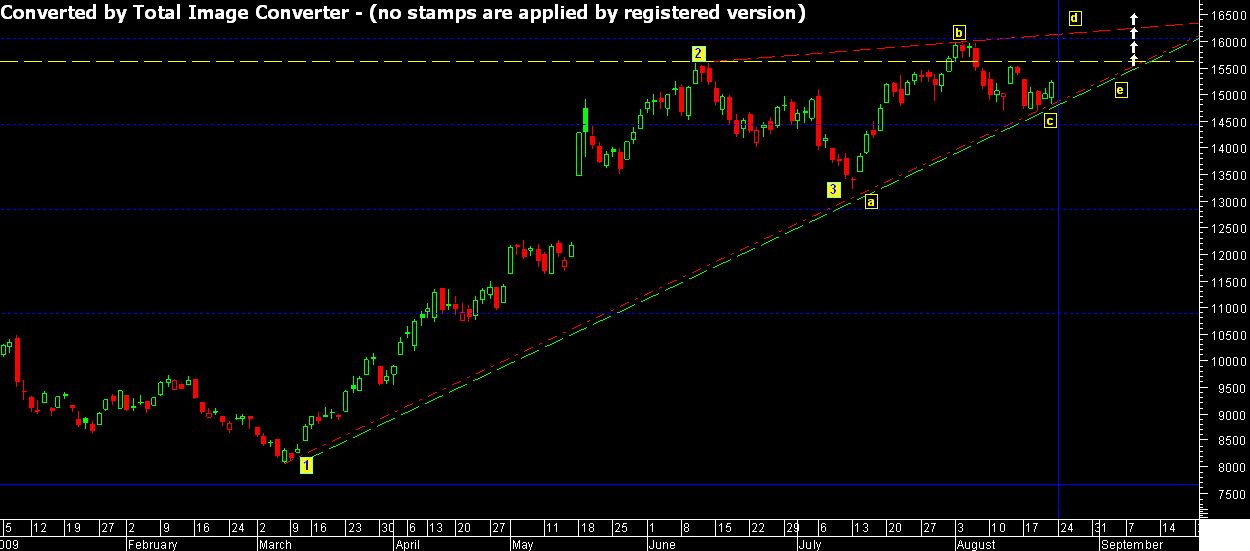
sensex
| Description: |
|
| Filesize: |
80.2 KB |
| Viewed: |
7335 Time(s) |
|
|
|
| Back to top |
|
 |
r.dibya
White Belt

Joined: 26 Jun 2008
Posts: 79
|
Post: #9  Posted: Mon Aug 24, 2009 5:12 pm Post subject: Posted: Mon Aug 24, 2009 5:12 pm Post subject: |
 |
|
| u can check of sensex chart by scroll one by one
|
|
| Back to top |
|
 |
r.dibya
White Belt

Joined: 26 Jun 2008
Posts: 79
|
Post: #10  Posted: Tue Aug 25, 2009 5:01 pm Post subject: Posted: Tue Aug 25, 2009 5:01 pm Post subject: |
 |
|
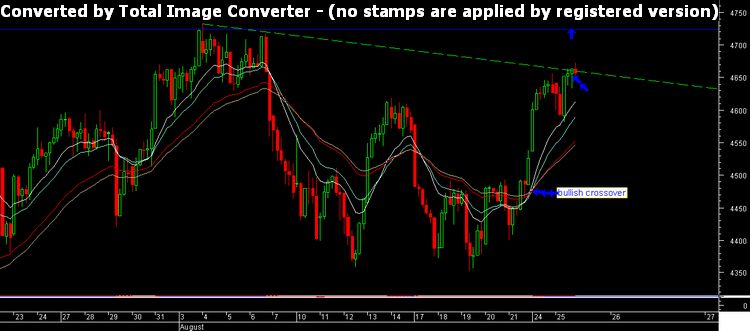
see nifty 1 hr. chart
| Description: |
|
| Filesize: |
40.82 KB |
| Viewed: |
7205 Time(s) |
|
|
|
| Back to top |
|
 |
r.dibya
White Belt

Joined: 26 Jun 2008
Posts: 79
|
Post: #11  Posted: Wed Aug 26, 2009 6:01 pm Post subject: Posted: Wed Aug 26, 2009 6:01 pm Post subject: |
 |
|
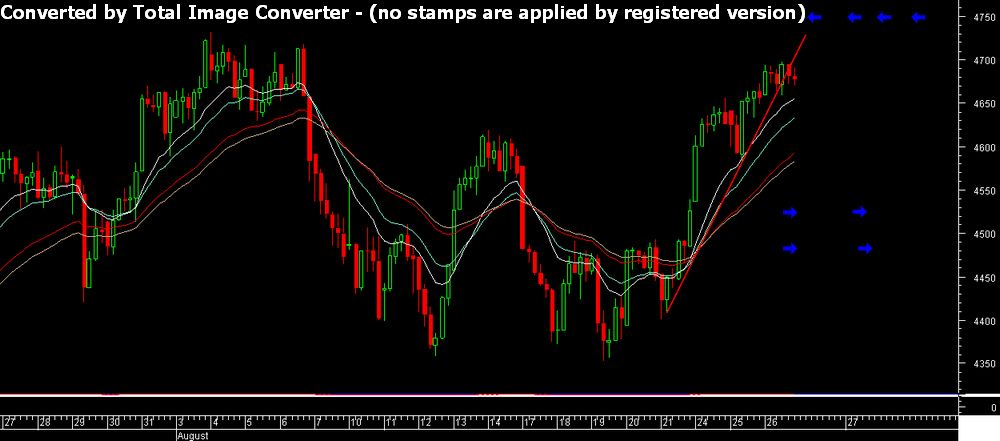
nifty may consolidate in between 4730/50---4480/4520 level for some days
| Description: |
|
| Filesize: |
58.05 KB |
| Viewed: |
7654 Time(s) |
|
|
|
| Back to top |
|
 |
r.dibya
White Belt

Joined: 26 Jun 2008
Posts: 79
|
Post: #12  Posted: Wed Aug 26, 2009 6:42 pm Post subject: Posted: Wed Aug 26, 2009 6:42 pm Post subject: |
 |
|
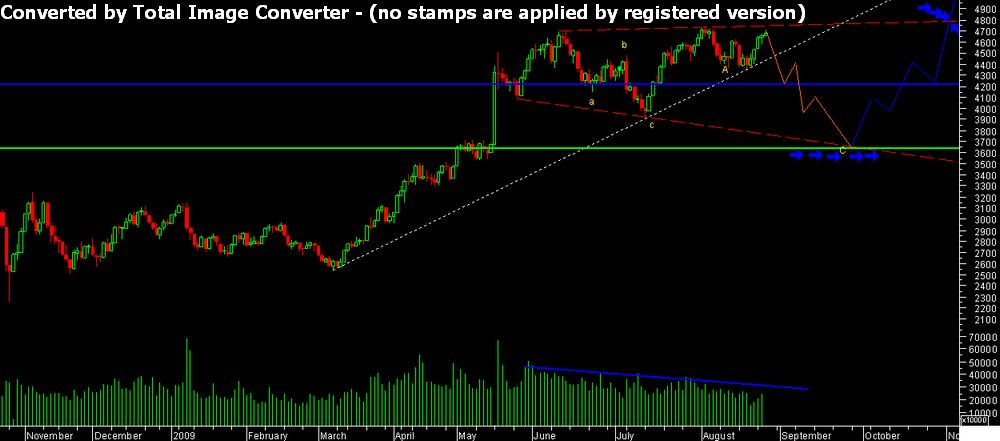
according elliott wave theory --nifty may reach near 3700-3900 level. but nifty is trading above strong support line near 4450-4500 so watch this level before take long position.
double top is there , so nifty couldn't cross that level (4750)
| Description: |
|
| Filesize: |
57.66 KB |
| Viewed: |
7644 Time(s) |
|
|
|
| Back to top |
|
 |
daitya
White Belt

Joined: 06 Apr 2009
Posts: 9
|
Post: #13  Posted: Thu Aug 27, 2009 5:18 pm Post subject: Posted: Thu Aug 27, 2009 5:18 pm Post subject: |
 |
|
| r.dibya wrote: | | see nifty 1 hr. chart |
Which are those 4 lines showing trend??
|
|
| Back to top |
|
 |
r.dibya
White Belt

Joined: 26 Jun 2008
Posts: 79
|
Post: #14  Posted: Fri Aug 28, 2009 12:10 am Post subject: Posted: Fri Aug 28, 2009 12:10 am Post subject: |
 |
|
these r moving avg.
but i am not bullish about CNXIT ( SHORT @CMP SL 120 POINTS ON CLOSING BASIS)
BUY STERLITE ABOVE 694 TGT. 770/940
|
|
| Back to top |
|
 |
r.dibya
White Belt

Joined: 26 Jun 2008
Posts: 79
|
Post: #15  Posted: Fri Aug 28, 2009 11:36 pm Post subject: Posted: Fri Aug 28, 2009 11:36 pm Post subject: |
 |
|
nifty couldnot croosed the 4750 level at last .so watch this level before take any long position. elliott wave theory tells nifty should come to 4500/50 level or down more but Inverted H&S pattern is there for bullish .
if u see in commodities ----bullish in ahead.
dollar----consolidate/bearish.
dow ---consolidate.
china index------near support level.
if china will go up then commodities will go up up up .china index is a leading indicator in all over index. so still this index is not in bearish position.
all total-----if nifty is trading above /sustain /closing--4750 level then take long position
bullish script------punjlloyd,ster,bharti(above 435),reliance( above 2070-2104),ifci(above 57/5 ,FT,jpassociate ,FT,jpassociate
if nifty fall below 4600 then take short position for 100 points & watch this level for uptrend
|
|
| Back to top |
|
 |
|

